Could someone please guide me with the steps to fetch Jenkins logs using the OpenTelemetry plugin and display the metrics in Kibana? I have already configured Elasticsearch and Kibana in my Kubernetes cluster.
Hi @Tortoise
I have completed the backend setup using the following manifest files: apmServer/apmIngress/apmService/oTel-deployment and config/oTelIngress/otelService. All manifests have been successfully deployed and are currently running, confirmed by a status 200 response in the CLI.
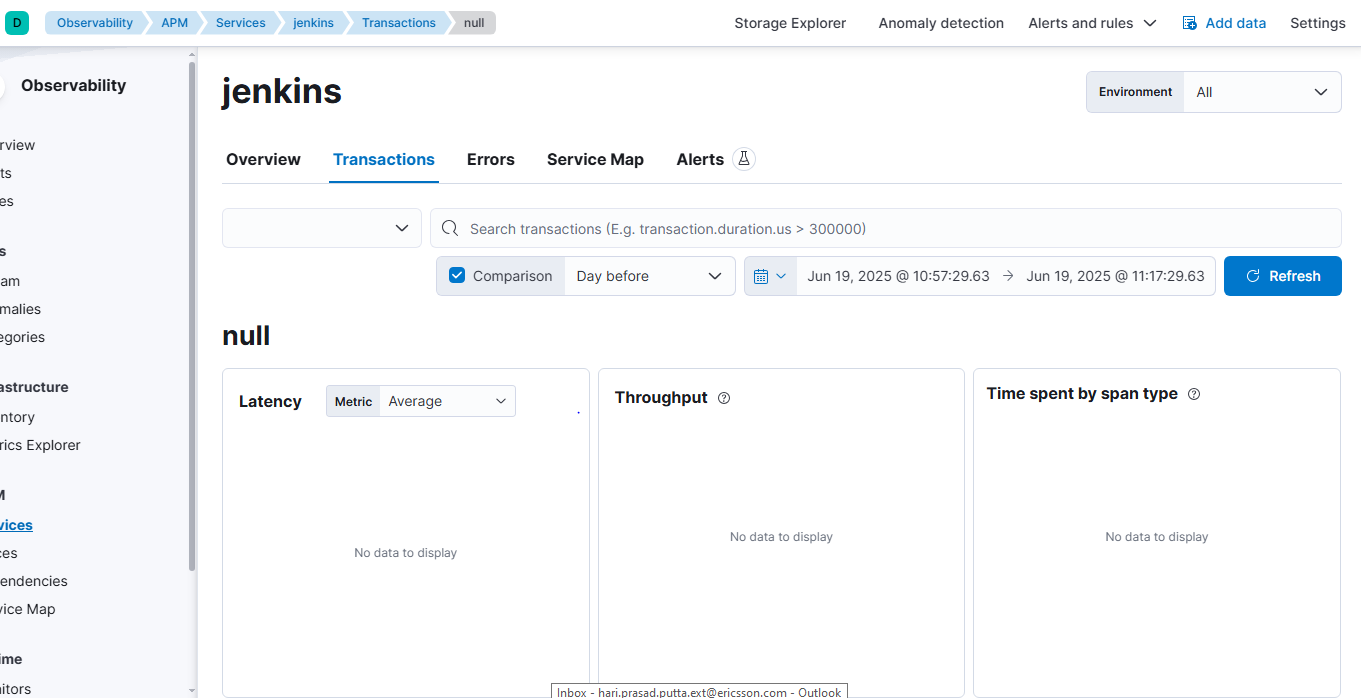
In Jenkins, I configured the OTLP endpoint to point to the oTel Ingress URL and set the Kibana URL as the Kibana endpoint. After creating and triggering a sample pipeline, the pipeline status shows as green. However, when I click on "Open Telemetry View" under "View Pipeline with Elastic Observability," it redirects to Kibana, where no data is displayed and the message "No data to display" appears.

Also upon selecting "Store pipeline logs in Elastic" and "Visualize logs both in Elastic and through Jenkins", the logs are not appearing in Jenkins.