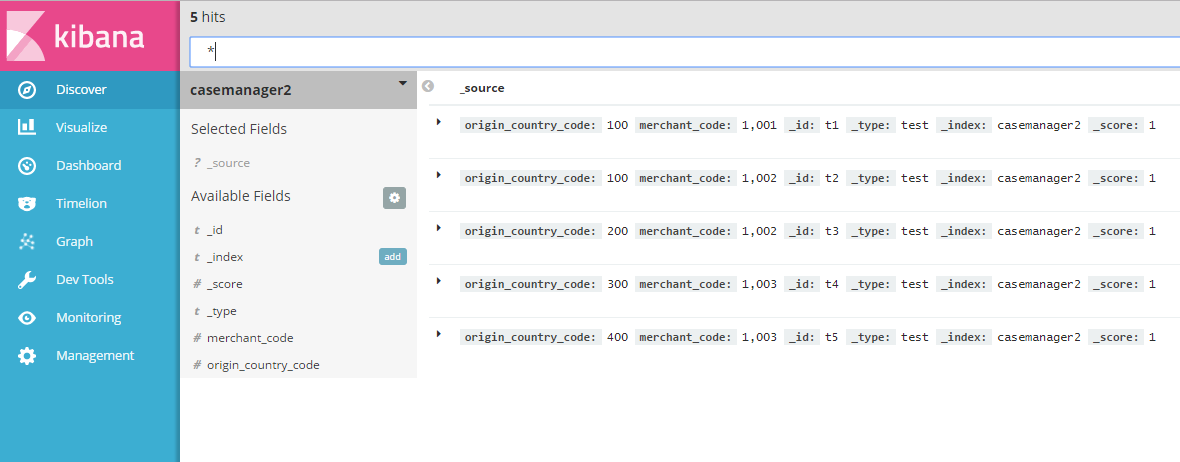
I have inserted the below data into the elasticsearch and trying to view it in Kibana - graph options.
I am using Kibana 5.2.2. Added the below records. Added the 2 columns and selected 2 icons. what are the next steps to view the graph
curl -XPUT 'http://10.51.88.17:9200/casemanager2/test/t2' -d '{"origin_country_code": 100,"merchant_code" : 1002}';
curl -XPUT 'http://10.51.88.17:9200/casemanager2/test/t3' -d '{"origin_country_code": 200,"merchant_code" : 1002}';
curl -XPUT 'http://10.51.88.17:9200/casemanager2/test/t4' -d '{"origin_country_code": 300,"merchant_code" : 1003}';
curl -XPUT 'http://10.51.88.17:920

Can someone look into this question ?
You need to search for something against those fields, like a specific merchant or country code.

Can some one please check this issue