Hello,
spi,ip
Nothing appears in the Kibana graph when choosing ip,sip as columns.
Thanks,
jsanz
March 7, 2022, 4:20pm
2
Not sure what may be wrong with your approach but let me put the steps I used to replicate your example:
Create the index:
DELETE chart_test

PUT chart_test
{
  "mappings": {
    "properties": {
      "spi": { "type": "text" },
      "ip": { "type": "keyword" }
    }
  }
}

PUT _bulk
{ "index" : { "_index" : "chart_test", "_id" : "1" } }
{ "spi" : "sp1", "ip": "ip1" }
{ "index" : { "_index" : "chart_test", "_id" : "2" } }
{ "spi" : "sp2", "ip": "ip1" }
{ "index" : { "_index" : "chart_test", "_id" : "3" } }
{ "spi" : "sp3", "ip": "ip1" }
{ "index" : { "_index" : "chart_test", "_id" : "4" } }
{ "spi" : "sp4", "ip": "ip2" }
{ "index" : { "_index" : "chart_test", "_id" : "5" } }
{ "spi" : "sp5", "ip": "ip2" }
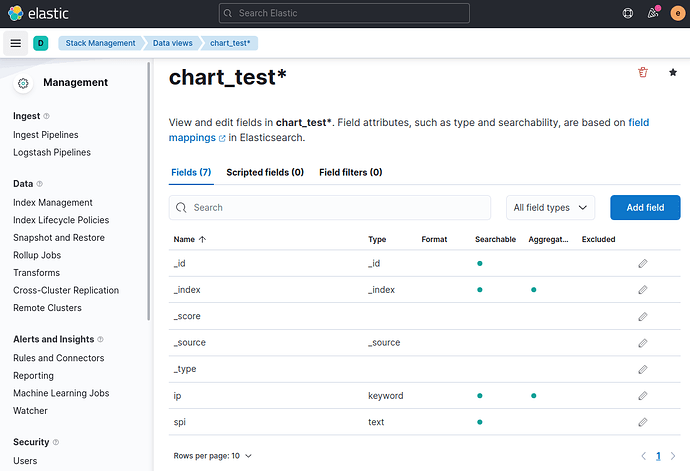
Create the Data View:
Create a bar chart plotting the count of ip:
Is this similar to what you tried? What is different?
system
April 4, 2022, 4:21pm
3
This topic was automatically closed 28 days after the last reply. New replies are no longer allowed.

