Hello,
I try create chart but ...
I have 4 queries:
Messages Sent (Internal) "query": "event_id: \"SEND\" AND connector_id: \"Intra-Organization SMTP Send Connector\" AND directionality: \"Originating\""
Hi @zen.xen,
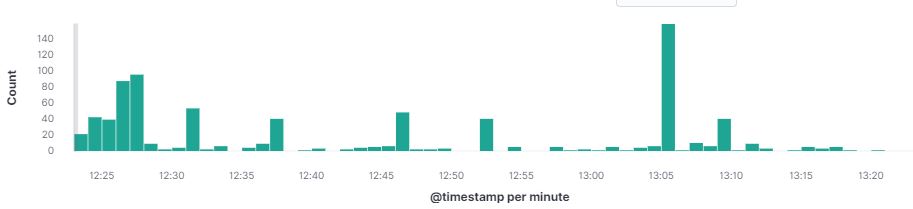
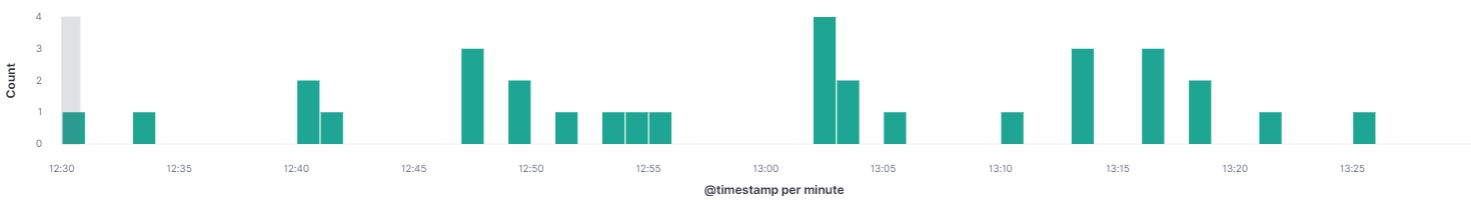
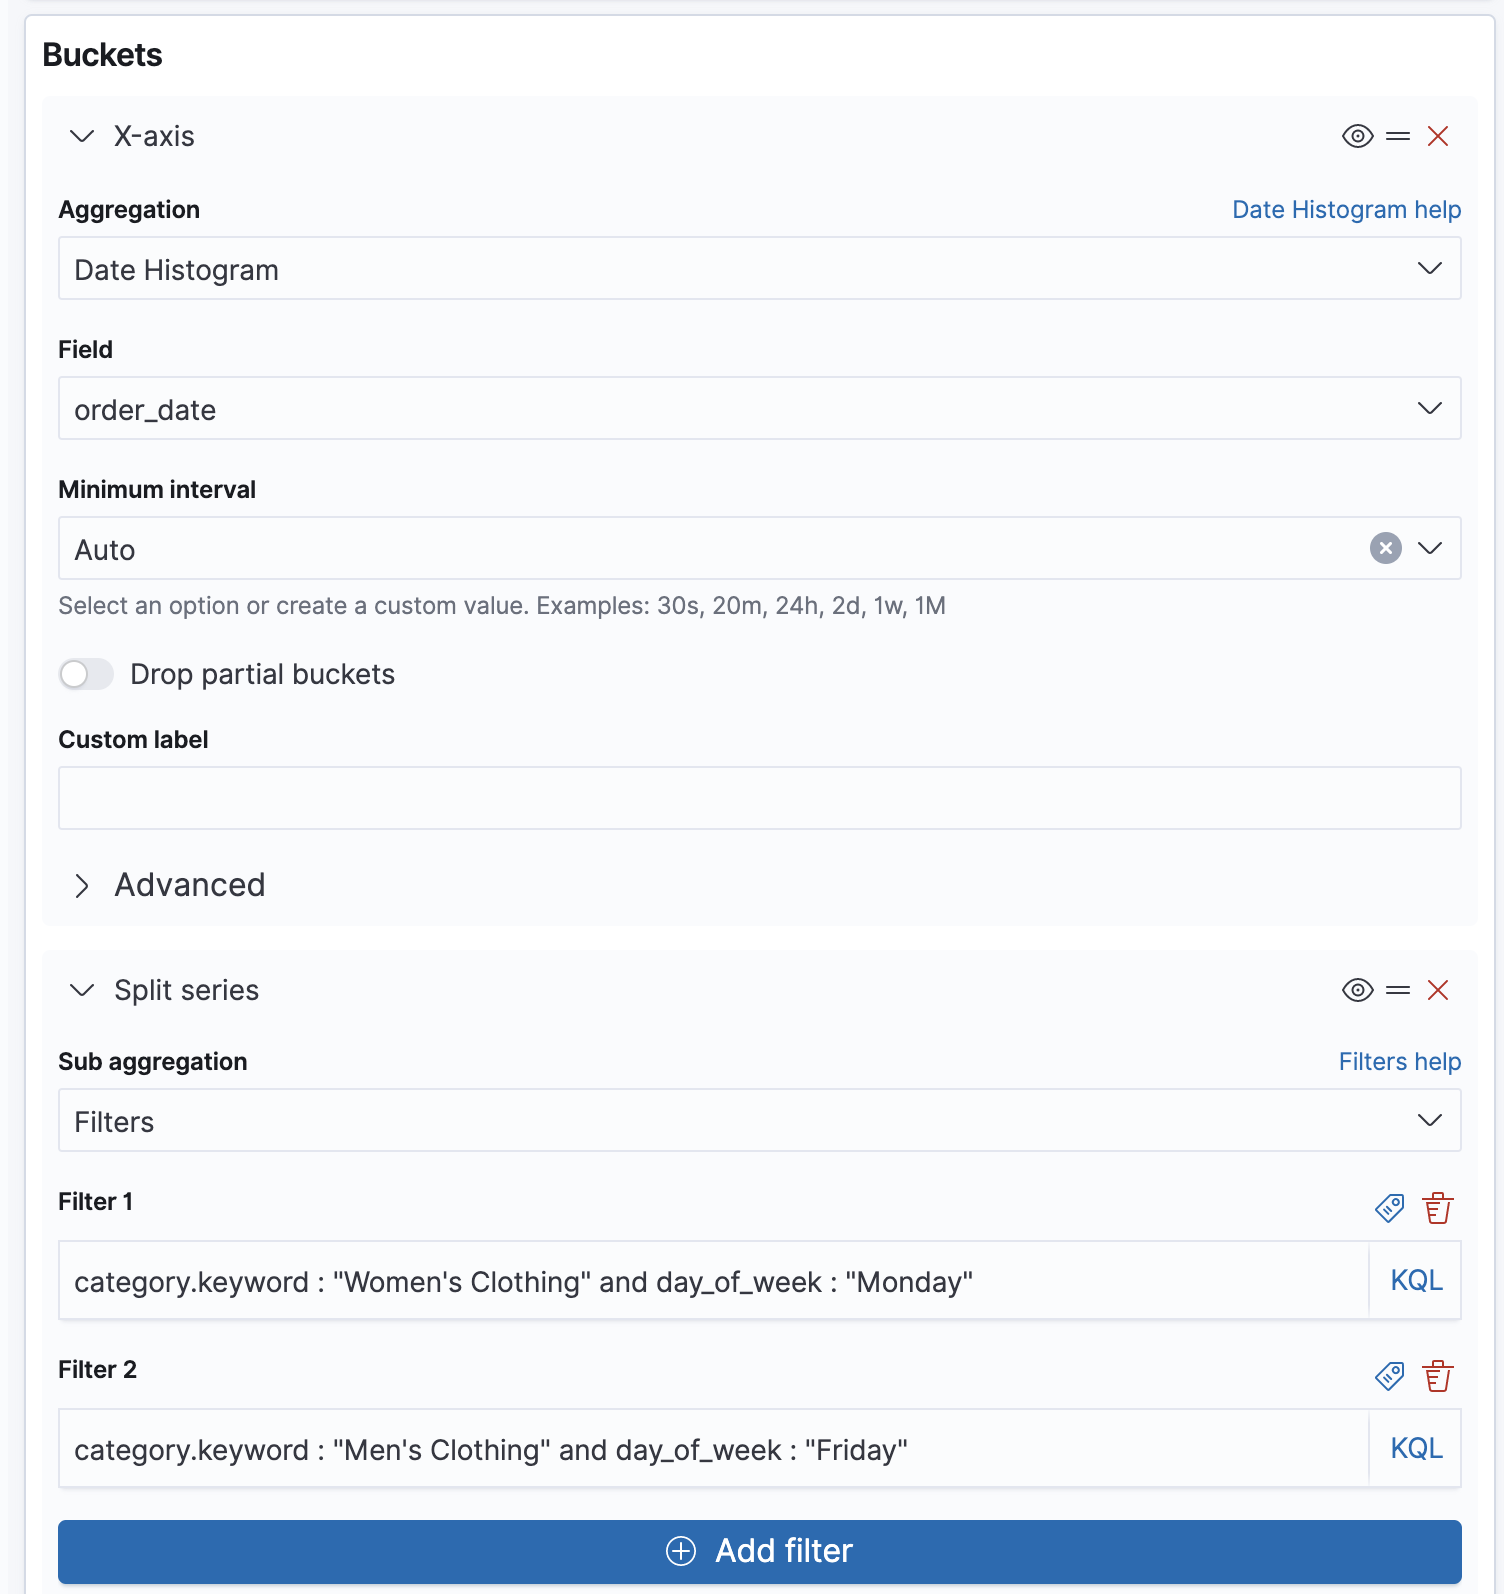
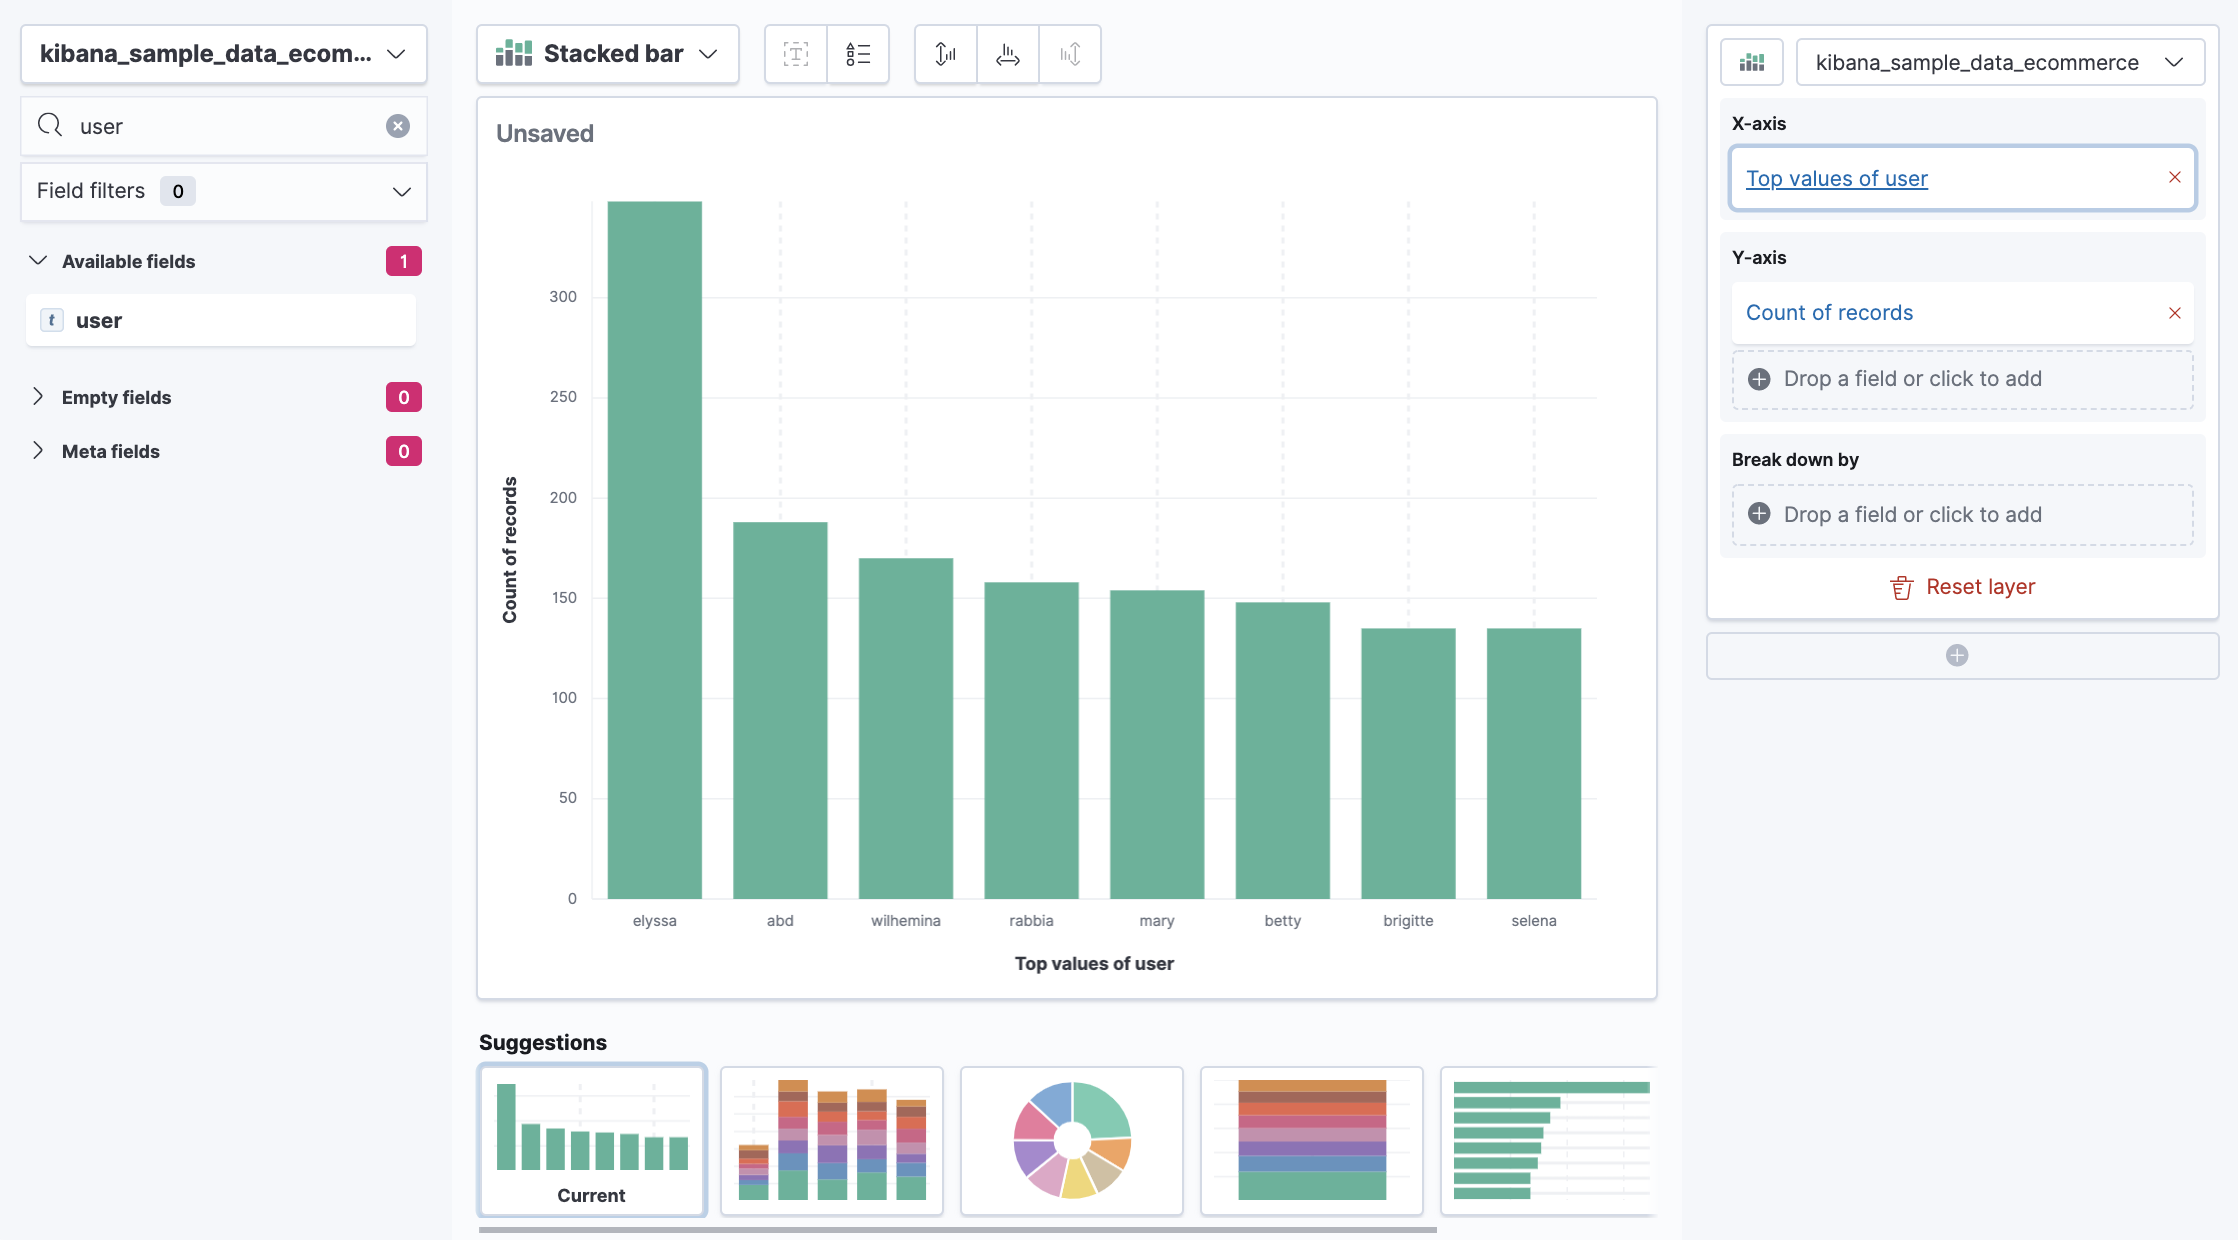
from my understanding you could use Vertical Bar Chart. Your queries seem to be a bit complex so what you need is to create filters aggregation, you can also add custom labels. Here's the example with sample data:
Btw, I noticed you are using lens to creating your chart – the filters functionality for Lens will appear in the upcoming version 7.10.
Let me know if you need further guidance.
Hello @Marta_Bondyra,
your advice is perfect, I have created 4 filters, used Vertical Bar Chart and now my chart looks like I wanted. Thanks for help and have a nice day.
Hello @Marta_Bondyra,
recently you have helped me very much. I need another advice, I tried many combinations but all failed.
I have logs from winlogbeat, they look like these
Time						message						winlog.user.name	winlog.user_data.Param8
Oct 13, 2020 @ 13:22:23.686	Document 30, Print Document userA				6
Oct 13, 2020 @ 13:10:16.047	Document 29, Print Document userB				1
Oct 13, 2020 @ 13:04:21.049	Document 28, Print Document userC				2
Oct 13, 2020 @ 12:56:23.686	Document 27, Print Document userB				2
Oct 13, 2020 @ 12:54:18.047	Document 26, Print Document userB				1
Oct 13, 2020 @ 12:50:24.049	Document 25, Print Document userC				1
If you know at the beginning how many more or less users you have, remember to slide up the slider clicking on the X-axis 'Top values of user' button.
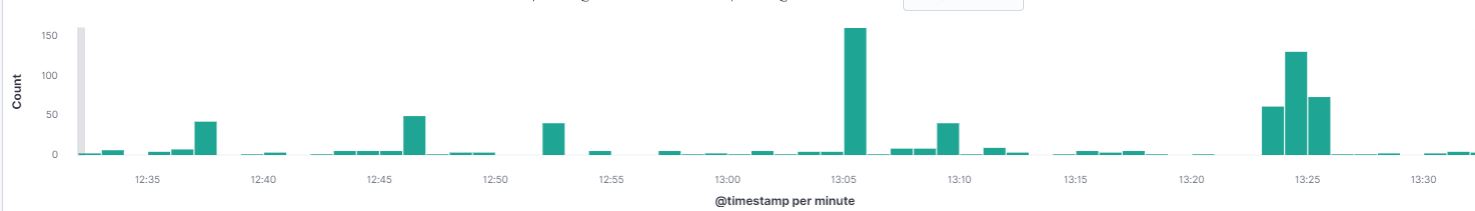
Second option (this is the option when you don't want to get top values of the field 'winlog.user.name' but only some specific values (like you want to ignore userD which happens to have the most entries and only display values from users A, B and C) is to create filters aggregation vizualization again, just like in the example in my previous answer (count on Y-axis and filters in X-axis )
Hi @Marta_Bondyra,
I don't use lens to create visualization, I don't have x-pack because I use Bitnami ELK stack, I only use Buckets with proper filters like in your previous post.
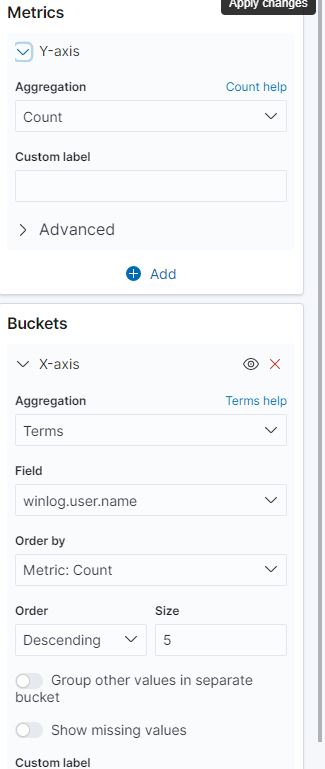
@zen.xen instead of filters, you can also use 'terms' aggregation on vertical bar which is equivalent of Lens - it will give top (x) values of a field 'user'.
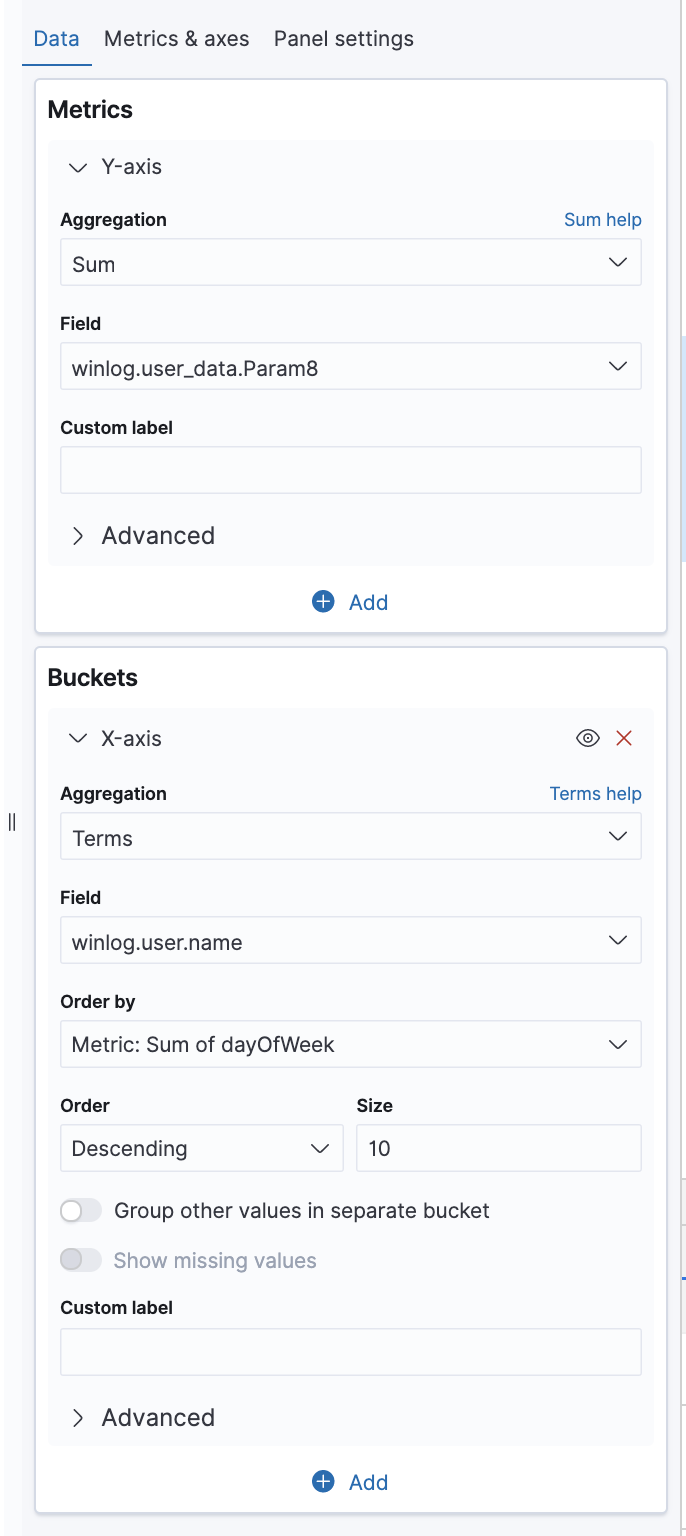
Not sure what's the structure of your data, but if you have a field, eg. pages_printed, instead of Aggregation of 'Count' on Y-axis, use aggregation sum of a field you want to sum, so in my example case pages_printed.
Hello @Marta_Bondyra,
it doesn't work but now I know why. Let me explain, in your example there is one thing, in the Y-axis > field there appeared winlog.user_data.Param8, I got flash of insight, I have checked how winlogbeat treats that field, in my case this field is STRING type. In Windows there is an Event ID=307 in Microsoft-Windows-PrintService/Operational and this looks sth like this
Document 128, Print Document owned by xxx was printed ...... . Pages printed: 2. No user action is required.
So, I can't sum how many pages were printed by user.
Maybe you know, is it possible to convert string to number in winlogbeat?
it would be the easiest if you could ingest the data as number, but the workaround would be to create scripted field and then use scripted field with a script like that:
Apache, Apache Lucene, Apache Hadoop, Hadoop, HDFS and the yellow elephant
logo are trademarks of the
Apache Software Foundation
in the United States and/or other countries.