Hi all,
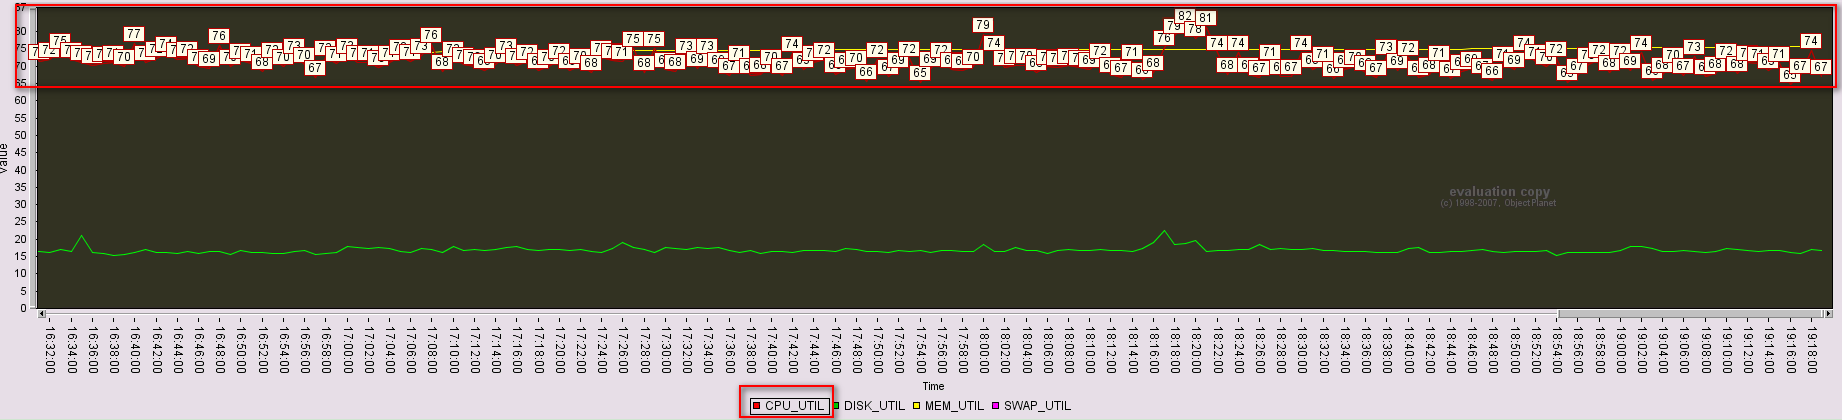
I created a line chart to show CPU utilization,I know it could show the value when I click the point of the line,but how to display values automatically along with the line when click the right item(such as Max cpu-total):
Apache, Apache Lucene, Apache Hadoop, Hadoop, HDFS and the yellow elephant
logo are trademarks of the
Apache Software Foundation
in the United States and/or other countries.