Hi,
I am using Elastic cloud to send our Nginx logs using Filebeat Nginx module.
However, the Nginx log is not parsed and gives "Provided Grok expressions do not match field value" error.
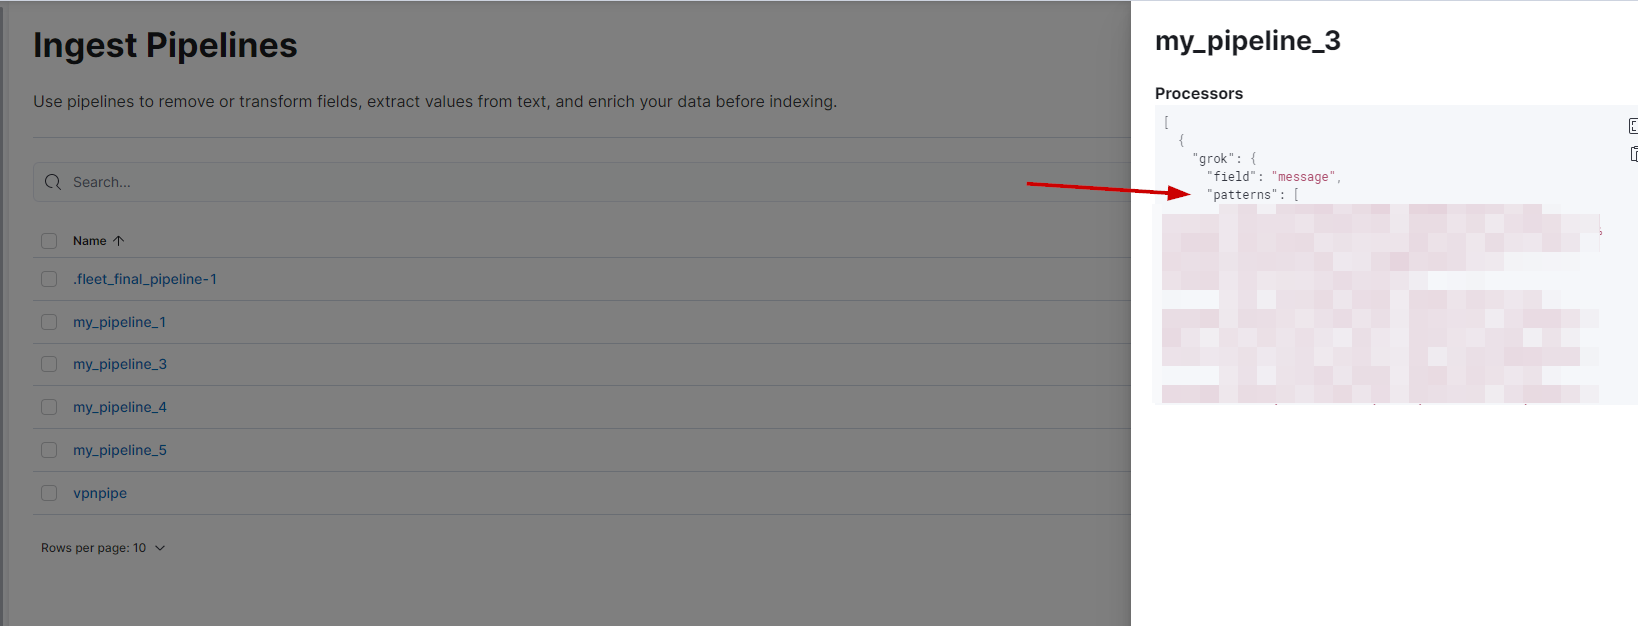
The event.original field that contains the log is of JSON format. And I want to change the processor from Grok to JSON in the ingest pipeline.
However, I cannot figure out which ingest pipeline is used in Kibana to parse my Nginx logs.
How can I find out which pipeline is used and to change the pipeline? Is this something I can do in Kibana, or do I need change the configuration file?
This is my nginx.yml config:
- module: nginx
  access:
    enabled: true
    input:
      pipeline: filebeat-8.2.0-nginx-access-pipeline-custom
    var.paths: ["/shared/log/access_nginx.log"]
  error:
    enabled: true
    var.paths: ["/shared/log/error_nginx.log"]
Thank you.