Hey @Sergie , sorry for my even more late reply this time, I've been pretty sick over the last week...
So, be ready because this is another complex one! 
These 2 numbers - while in the same section and displayed bascially next to each other - are not calculated the same way at all.
In summary, both want to highlight a relation between the visualized alert and some threat intelligence related data. While the threat matches detected value is a persistent value that happens when the alert is created, the value for fields enriched with threat intelligence is not persistent and calculated when we open the flyout.
Let me explain each a bit more in details:
- Threat match detected
This value represents the number of documents related to the alert by a certain field. Let's take an example here: I'm going to create 2 indices then run an Indicator match rule to create alerts that will have the correct values to show something in the threat match detected section.
First create a new index, set it's mapping and add a basic document to it:
PUT test-index
PUT test-index/_mapping
{
  "properties": {
    "@timestamp": {
      "type": "date"
    },
    "file": {
        "properties": {
          "hash": {
            "properties": {
              "md5": {
                "type": "keyword",
                "ignore_above": 1024
              },
              "sha1": {
                "type": "keyword",
                "ignore_above": 1024
              },
              "sha256": {
                "type": "keyword",
                "ignore_above": 1024
              }
            }
          }
        }
    }
  }
}
POST test-index/_doc
{
  "@timestamp": 1748376265490,
  "file.hash.sha256":"abcdef"
}
Then I'm going to create a second index, set its mapping and add a document that will match the value in the previously added document:
PUT threat-index
PUT threat-index/_mapping
{
  "properties": {
    "@timestamp": {
      "type": "date"
    }
  }
}
POST threat-index/_doc
{
  "@timestamp": 1748376265490,
  "threat.indicator.file.hash.sha256": "abcdef"
}
Now if I create a new Indicator Match rule that match my file.hash.sha256 field with the threat.indicator.file.hash.sha256 field (you can find all the field pairs here, this will generate one alert that will be enriched with the following fields:
You can see on that picture that that alert has a
threat.enrichments field with the following information:
- the index of where the threat documents are
- the field that the alert matched against (in our case
file.hash.sha256)
- the value of the field (in our case
abcdef)
If you expand the flyout (with the Expand details button in the top left corner, or by clicking on the Threat Intelligence title of the section) you will see the following more detailed information:
Most of the logic for this section is in this hook. You'll see that first we look at which fields (that we call eventFields in the code) we care about here (that will match the array I provided as a link above), and the values are returned.
- Enriched with threat intelligence
This section is done in real time, meaning the value are calculated when you open the flyout. In the same hook linked right above, we also make a query to fetch some more data.
That query is:
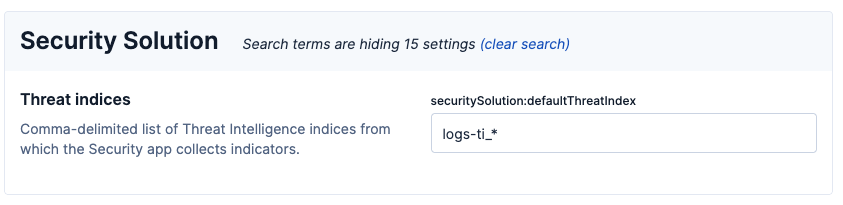
- looking at the indices entered in the
securitySolution:defaultThreatIndex, which you can access via the Advanced Settings under Security Solution -> Threat indices (by default you should just have logs-ti_*)
- by default fetching for the last 30 days to now. This is what is always used in the overview tab of the flyout. If you uses the expanded section of the flyout, you have a date picker that you can use whatever timeframe you want (just applied to the expanded section though).
- using the same
eventFields used in the previous section
Just FYI, before presenting the results, we're removing all the duplicates to make sure the same document will not appear in both sections.
I hope this helps! If you need more details I might have to reach out to the team that manages this as this is basically the extend of my knowledge 
Let me know!!