- As what you see in this image, this image is from the demo kibana site: demo url
- When I click the process like
javaorpythonin panelTop processes by memory usage, other panel like:CPU usage per processunder theTop processes by memory usageis also changed (cascade effect) - I want to know how to implement this??
- thanks so much for view my question
This is functionality that is built into Kibana automatically.
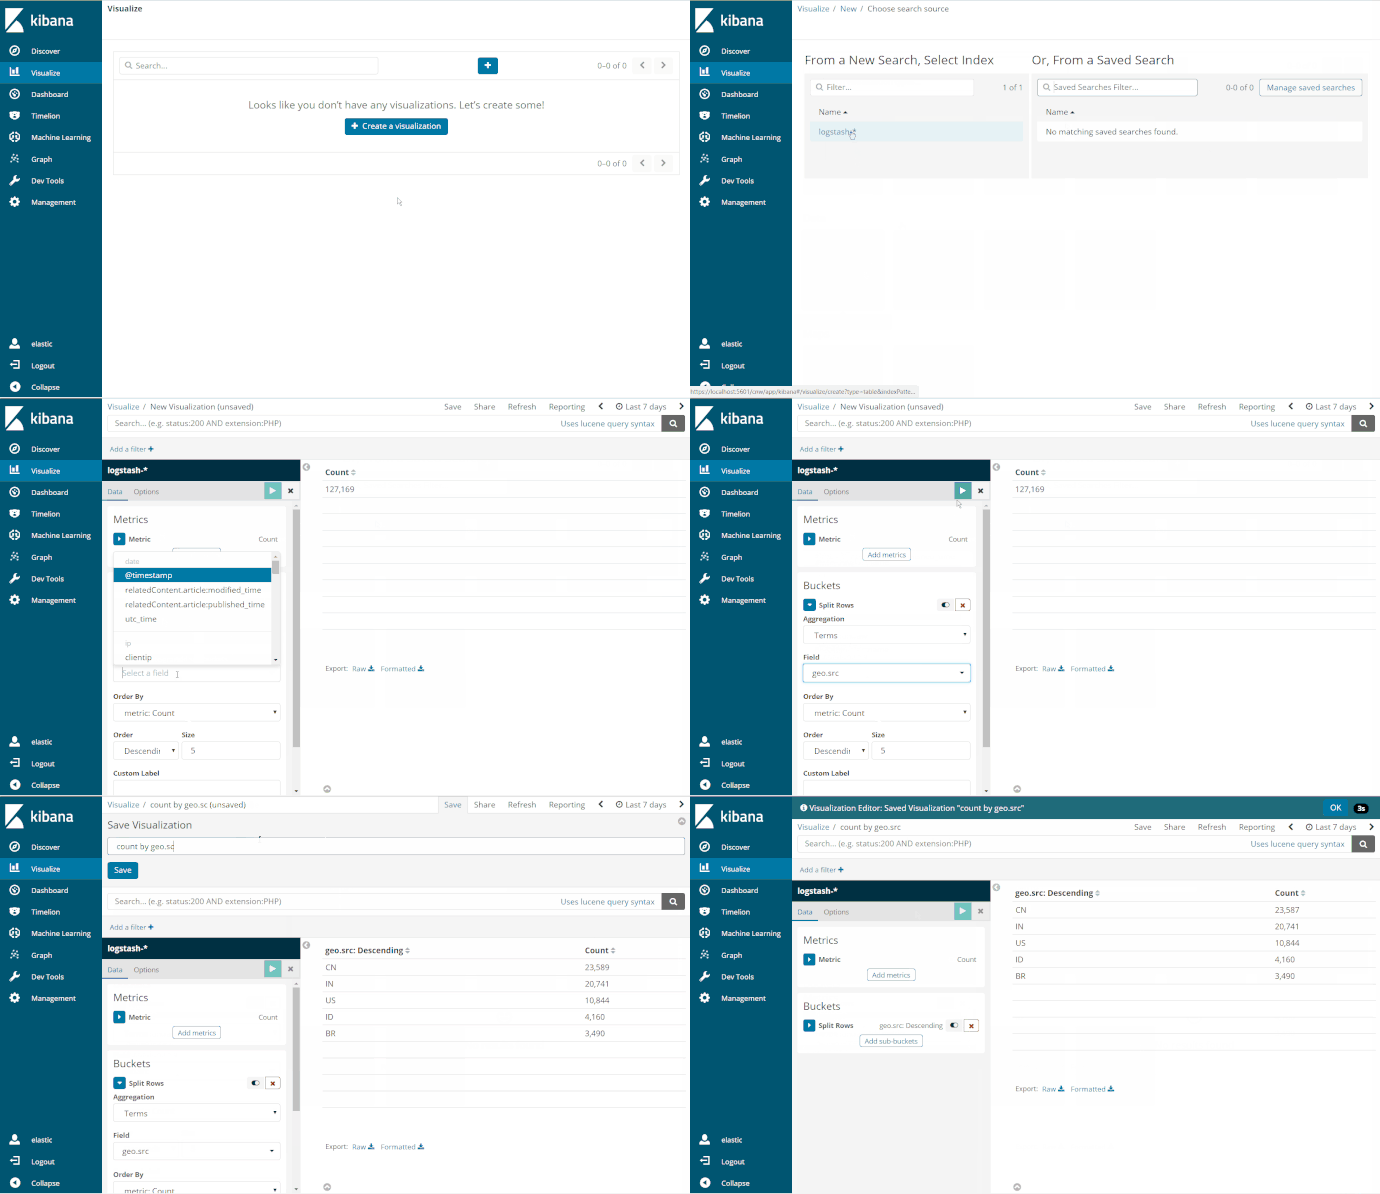
Create one visualization
Create a second visualization
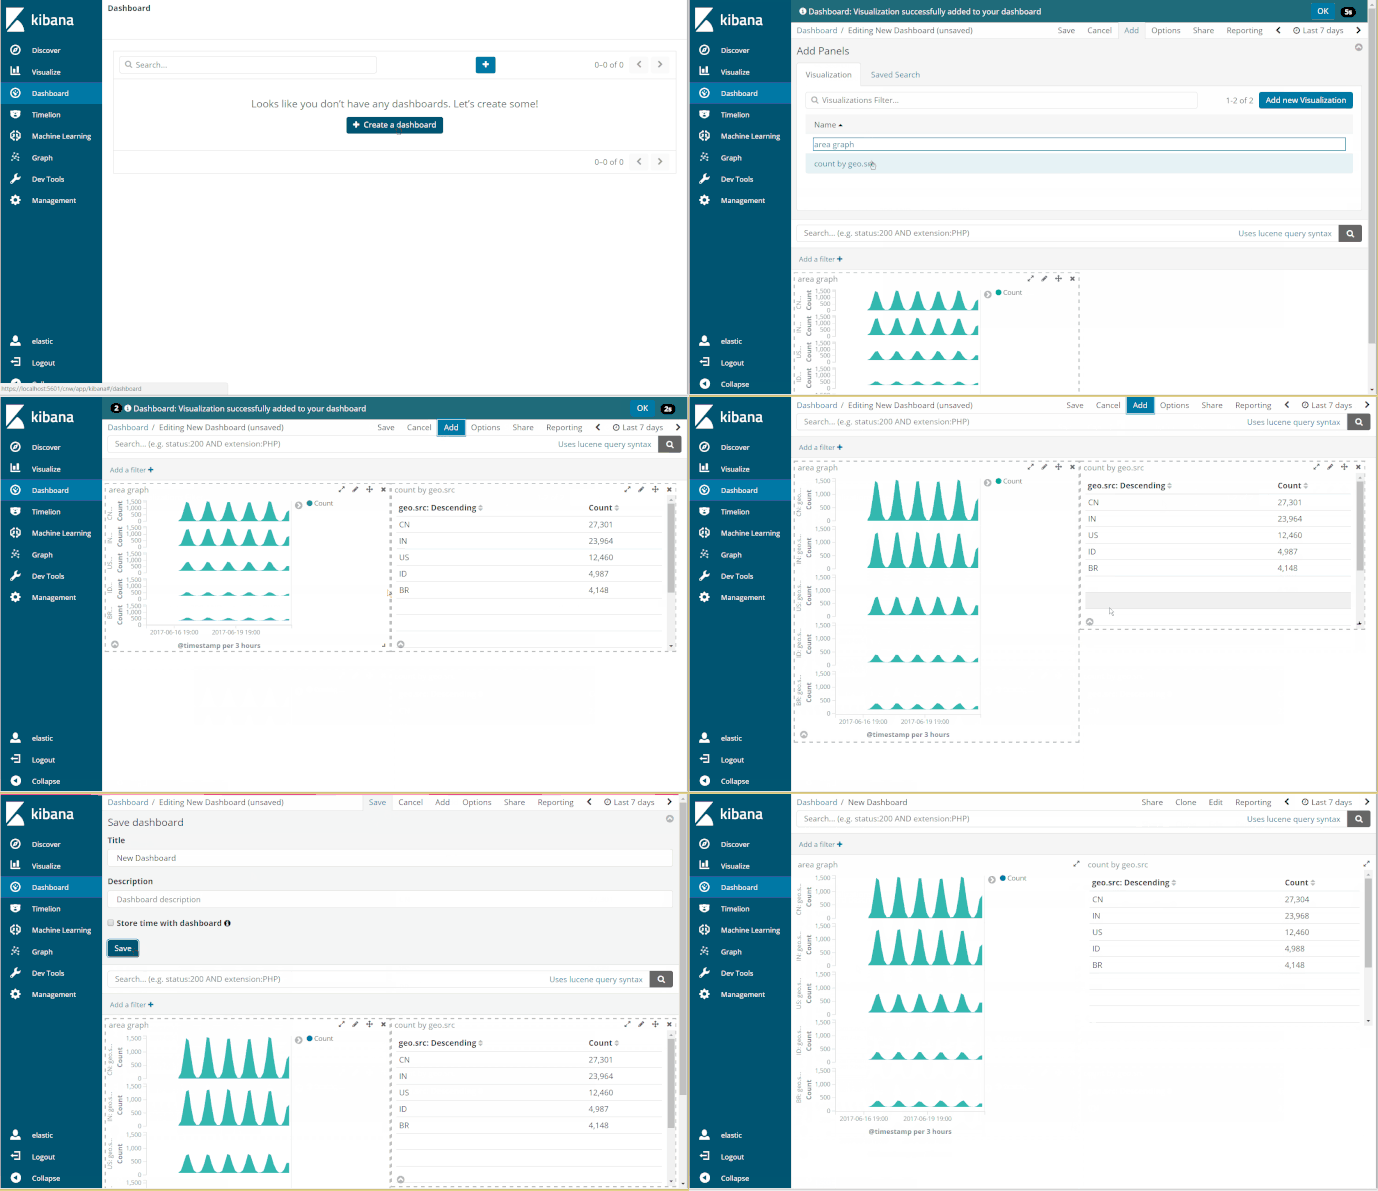
Add the both to a dashboard
Add a filter by clicking on the icons by a value
This topic was automatically closed 28 days after the last reply. New replies are no longer allowed.


