Kibana version : 5.4.0
Hello .
I have a goal to achieve but struggling with kibana interface so I would like to get some help with this.
My Goal
I will need to achieve below 2 steps
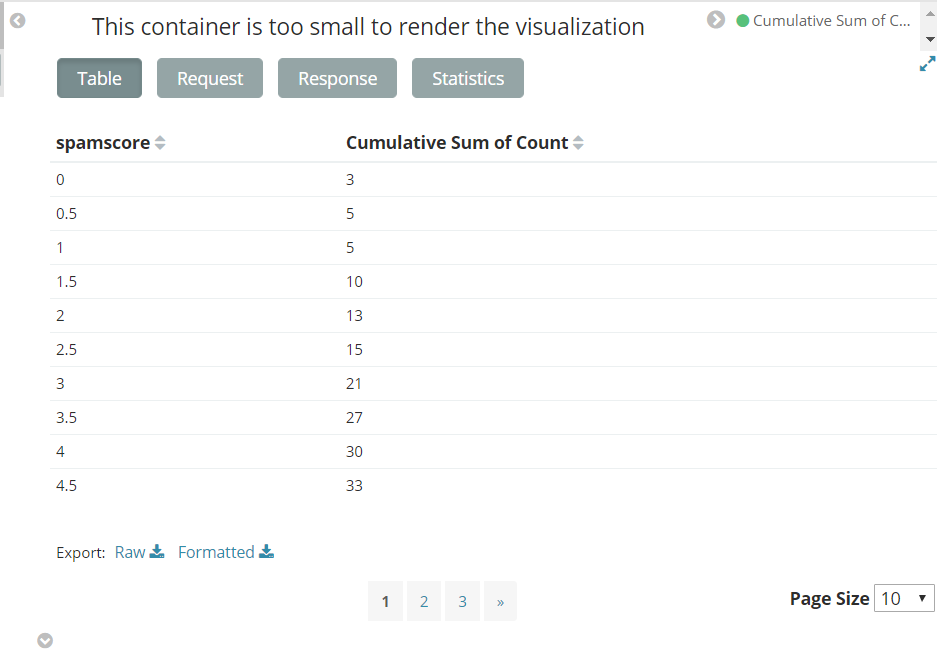
- Calculate the cumulative sum of field spamscore using the histogram bucket
- Using the cumulative sum I will need to calculate the ratio of against the total hits of search period.
For step2 , I will need to divide each histogram bucket by 73 (e.g 3 / 73 , 5/73,etc )
Currently, I have achieved step1 as below.
However, I am struggling with Step2. After reading the document , I assume that I will need to write script but not sure where to write it and how to access the cumulative sum series as doc field .
May I ask how can I achieve my goal?
Unfortunately, you are not currently able to chain aggregations in Visualize. However, this might be possible with Timelion if you are actually looking for a histogram.
What should the visualization look like in the end?
@thomasneirynck might be able to provide some insights.
@tsmalley
Thank you for the reply.
Ok. So input data will be below. Score will be the histogram in this case.

From above time series , I want to do aggregation like below.

From the data above I am trying to draw a chart like below. The charts consists of
- Counts per scores
- ratio of counts against cumulative sum of counts along the over the scores.

Can this be drawn on timelion ?
@tsmalley @thomasneirynck
Any luck ?
I have amended the original data series. Since it was the result aggregation instead.