Hello!
I have an error log file from nginx.
I am trying to upload and parse my file with Data Visualizer in Kibana v 7.10.1
Example of my error log
2021/07/21 04:44:36 [error] 7#7: *24864573 foo could not be resolved (110: Operation timed out), client: 10.1.1.2, server: , request: "GET /foo/api/info HTTP/1.1", host: "foo.bar.local"
2021/07/21 04:44:38 [error] 7#7: *24864628 favicon could not be resolved (110: Operation timed out), client: 10.1.1.2, server: , request: "GET /favicon.ico HTTP/1.1", host: "foo.bar.cloud"
grok pattern
(?<timestamp>%{YEAR}[./]%{MONTHNUM}[./]%{MONTHDAY} %{TIME}) \[%{LOGLEVEL:severity}\] %{POSINT:pid}#%{NUMBER:threadid}\: \*%{NUMBER:connectionid} %{GREEDYDATA:message}, client: %{IP:client}, server: %{GREEDYDATA:server}, request: "(?:%{WORD:verb} %{NOTSPACE:request}(?: HTTP/%{NUMBER:httpversion}))", host: %{GREEDYDATA:host}
When i am trying this log and grok pattern in Dev Tools - everything is all right, but when i am tryin to upload my file i have an issue.
My settings in Kibata upload settings
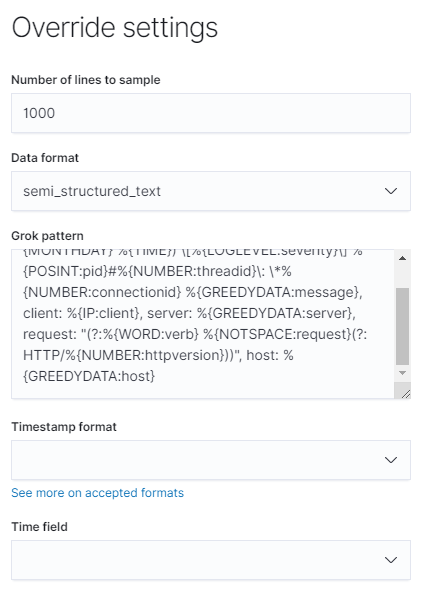
Answer is
File structure cannot be determined
If you know something about this data, such as the file format or timestamp format, adding initial overrides may help us to infer the rest of the structure.
I have tried various time formats in settings, but without seccess.
Can you help me with understanding of this error?