Hello,
We examine our Firewall logs related to a vulnerability scanner and we’d like to have a stats on ports it uses (destination.port) to adjust the Firewall configuration. So we’d like to have a table showing us all the port in use. Something like this screenshot but in table mode:

However, when we try to build a metric, we can’t find a way to show the destination port’s values. We have Average, Sum, Maximum but not values.

Do you know the way we could achieve our goal?
Thanks for the help.
Hi @Wooden_tree ,
So we’d like to have a table showing us all the port in use. Something like this screenshot but in table mode:
You can build a table for that very easily in Lens, but there's a limit on the number of values for the Top values function of 1000:
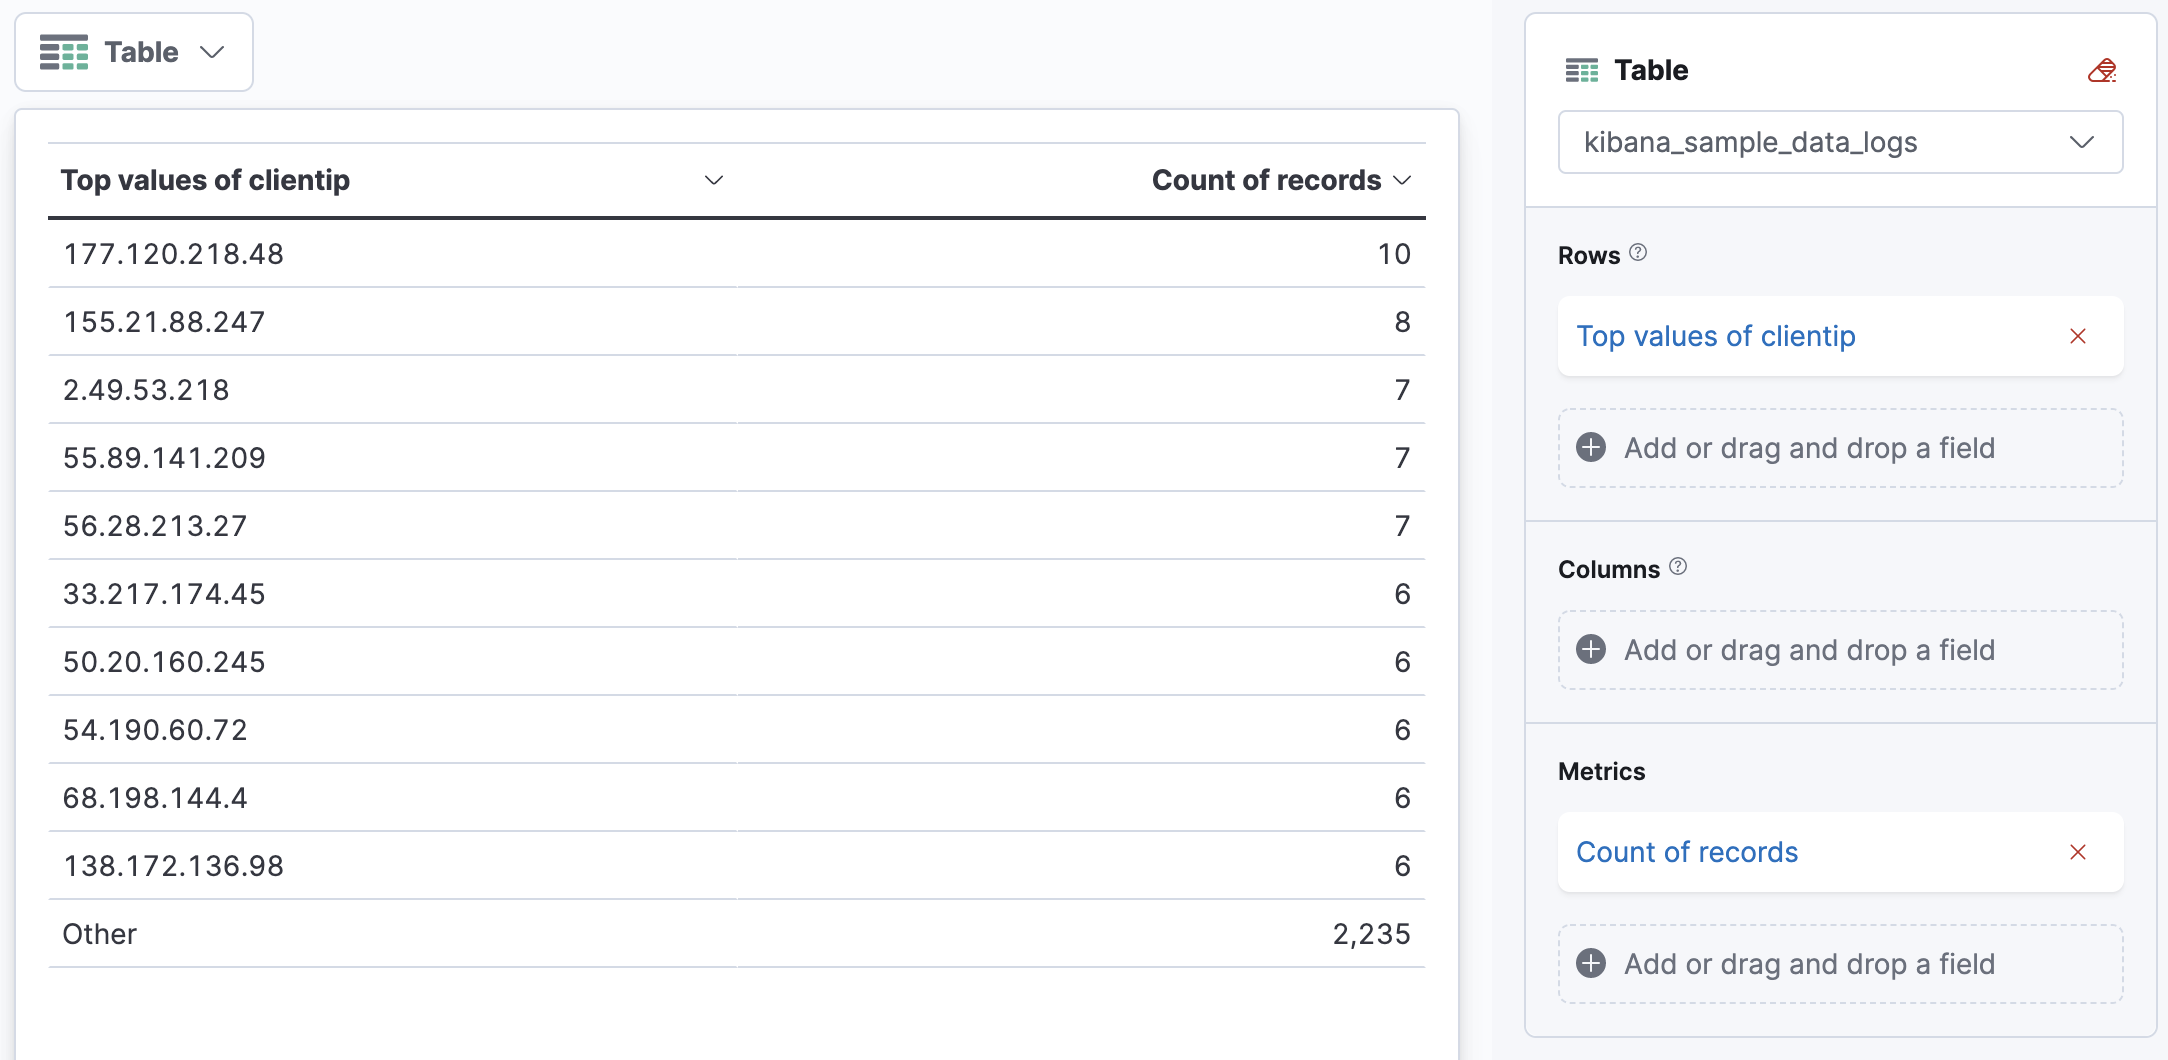
You cannot have percentages, but ordering by Count should be enough to get something close to the field popover - note Other will always be at the bottom.
Hi @Marco_Liberati,
That works great.
Thanks for the help!