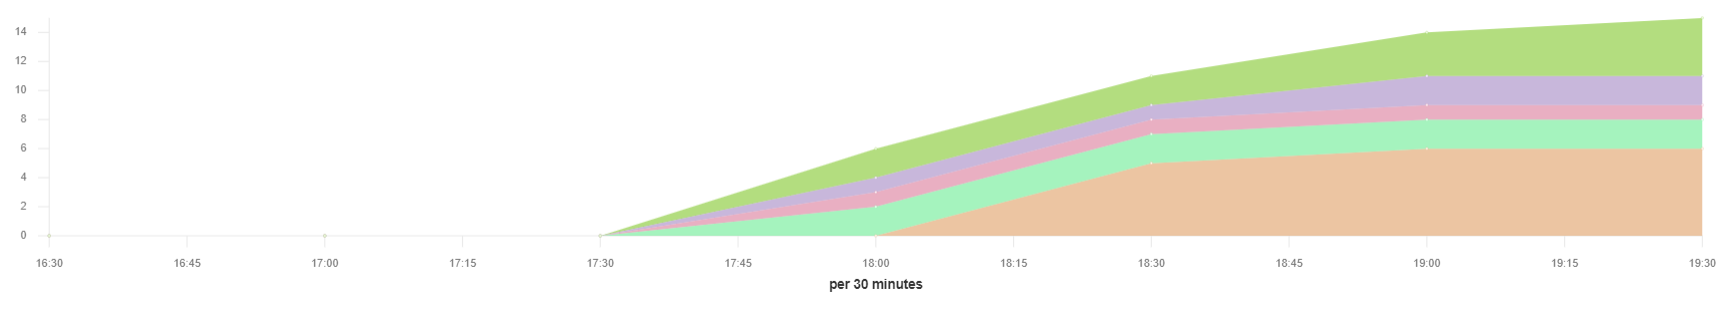
I will try to explain how we can view this chart, We have 8 Ready Stories on 10 June and 3 Work in Progress , we can see that the area under Ready stories are decreasing, the ready state stories are actually shifting through the different states and end up in Completed state
I understand that you want to take each workitem entity and visualize the change in status overall, but your data format requires transformation to do that. To visualize this in Kibana, I would recommend that you transform your data so that you have a multiple summary documents for each timestamp that you care about. Then you can build a stacked area chart using a Terms aggregation + Date Histogram aggregation on top of the summarized data.
You could use the ES Transforms feature to accomplish the summarization for you, or you may be able to accomplish this using Vega which is the most powerful tool in Kibana.
I just want to clarify one more thing, now I understand that I have to transform the data but I am not really sure that how should the output summarized data should look like.
A small example data could really help me.
I want this to be achieved in certain scenario : suppose if there are 4 completed states and 3 Ready states on 15th June, the next day we shift 1 workitem from ready state to completed state, now we should be seeing 2 in Ready state and 5 in completed state on 16th June.
And one more scenario can be like if no shifts happens the states remain same with the previous date.
I Believe we have to Transform the data in a way to fit these scenario's right ?
You need to implement exactly the logic you're describing in code somewhere, whether it's using Vega, Transforms, or an external script that performs the summary. If your goal is to visualize this using Kibana's built-in area charts, then the data format you'll need is something like this:
Notice that in my example above, I've repeated all the status summaries multiple times for each timestamp interval. This might require some complex scripting to achieve.
Apache, Apache Lucene, Apache Hadoop, Hadoop, HDFS and the yellow elephant
logo are trademarks of the
Apache Software Foundation
in the United States and/or other countries.