Identifying the cause of an unresponsive ES Cluster

We are running a 3 node cluster to index logs from a firewall.

The nodes are VMs (8 Core CPUs, 8GB RAM). The host runs on Intel i7, and has SSD storage.

We have Kibana running on one of the nodes. The interface becomes slow to the point of being unresponsive.

We have ILM enabled and the number of shards stay around 125. Which is well within the limits if were to go by official documentation here - JVM Heap of 12GB (4GBx3 nodes). Max shard count of 240 (1220).*

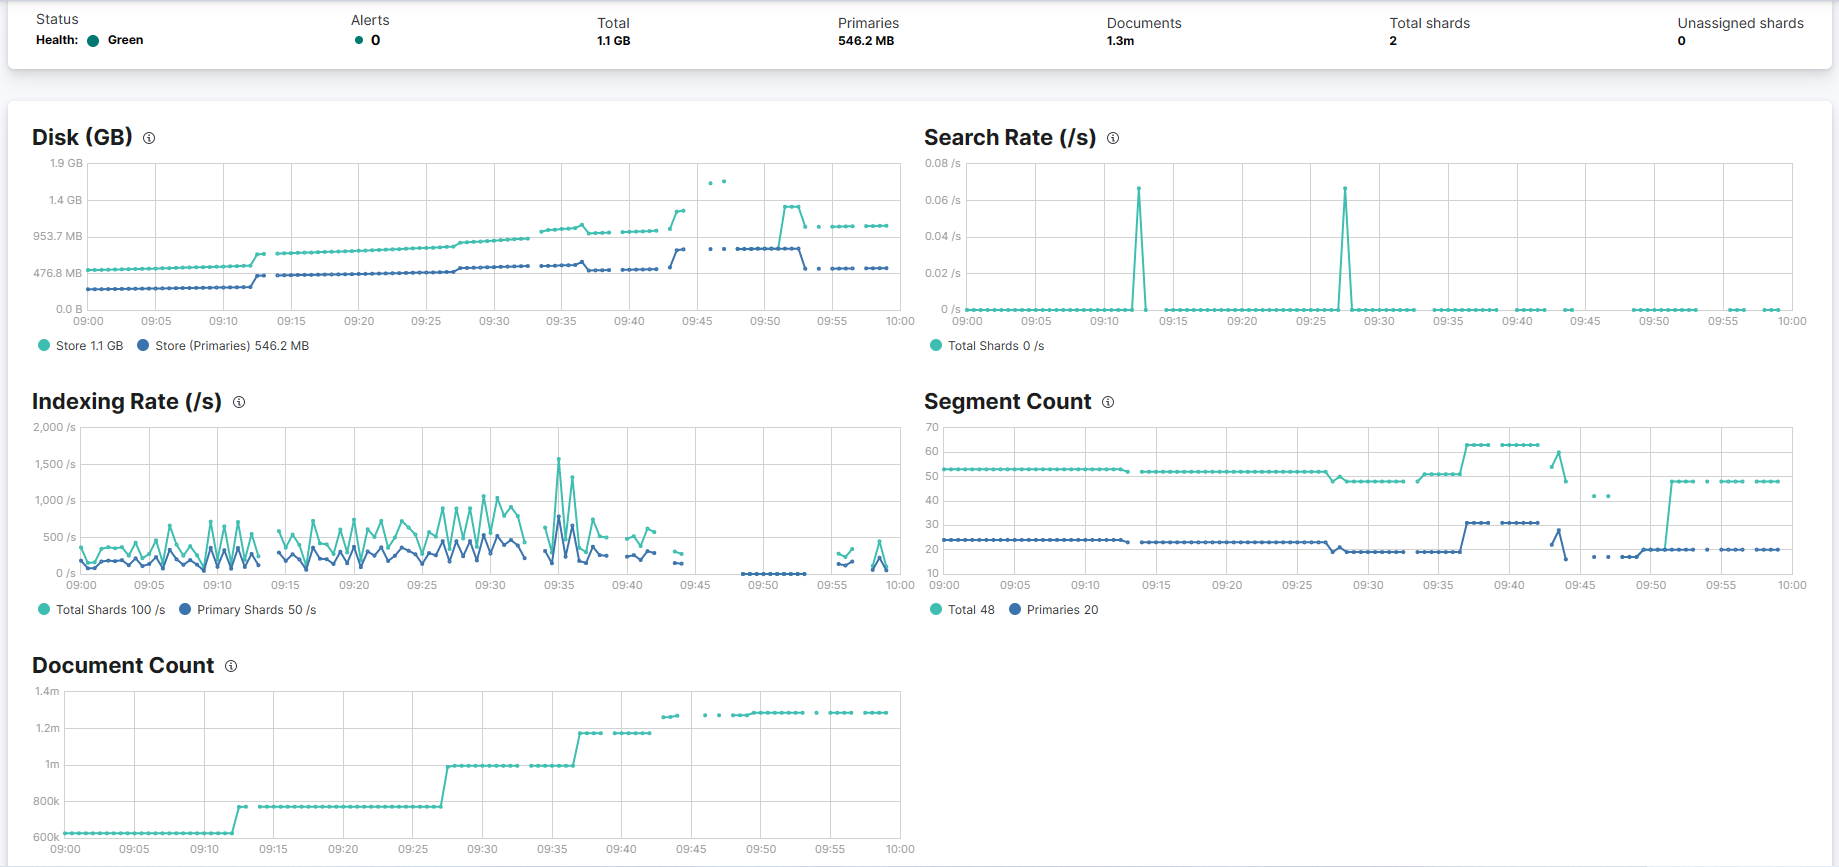
JVM memory allocation is done as per default, i.e, 50% of RAM. Some stats below:

There are frequent breaks in log ingestion visible in Kibana >> Observe

Breaks in indexing are also seen frequently while the system is unresponsive:

Elasticsearch logs:

Errors:


[2023-04-28T00:00:30,725][ERROR][o.e.x.m.c.c.ClusterStatsCollector] [es-node121] collector [cluster_stats] timed out when collecting data: node [LHj9iH-CTBesKk199fQHdA] did not respond within [10s]

[2023-04-28T00:03:51,060][ERROR][o.e.x.m.c.c.ClusterStatsCollector] [es-node121] collector [cluster_stats] timed out when collecting data: node [LHj9iH-CTBesKk199fQHdA] did not respond within [10s]

[2023-04-28T00:04:01,082][ERROR][o.e.x.m.c.i.IndexRecoveryCollector] [es-node121] collector [index_recovery] timed out when collecting data: node [LHj9iH-CTBesKk199fQHdA] did not respond within [10s]

[2023-04-28T00:09:01,625][ERROR][o.e.x.m.c.c.ClusterStatsCollector] [es-node121] collector [cluster_stats] timed out when collecting data: node [LHj9iH-CTBesKk199fQHdA] did not respond within [10s]

[2023-04-28T00:09:11,638][ERROR][o.e.x.m.c.i.IndexRecoveryCollector] [es-node121] collector [index_recovery] timed out when collecting data: node [LHj9iH-CTBesKk199fQHdA] did not respond within [10s]

[2023-04-28T00:11:31,747][ERROR][o.e.x.m.c.c.ClusterStatsCollector] [es-node121] collector [cluster_stats] timed out when collecting data: node [LHj9iH-CTBesKk199fQHdA] did not respond within [10s]

[2023-04-28T00:14:21,875][ERROR][o.e.x.m.c.c.ClusterStatsCollector] [es-node121] collector [cluster_stats] timed out when collecting data: node [LHj9iH-CTBesKk199fQHdA] did not respond within [10s]

[2023-04-28T00:18:52,006][ERROR][o.e.x.m.c.c.ClusterStatsCollector] [es-node121] collector [cluster_stats] timed out when collecting data: node [LHj9iH-CTBesKk199fQHdA] did not respond within [10s]

[2023-04-28T00:21:42,095][ERROR][o.e.x.m.c.c.ClusterStatsCollector] [es-node121] collector [cluster_stats] timed out when collecting data: node [LHj9iH-CTBesKk199fQHdA] did not respond within [10s]

[2023-04-28T00:25:22,181][ERROR][o.e.x.m.c.c.ClusterStatsCollector] [es-node121] collector [cluster_stats] timed out when collecting data: node [LHj9iH-CTBesKk199fQHdA] did not respond within [10s]

[2023-04-28T00:27:22,258][ERROR][o.e.x.m.c.c.ClusterStatsCollector] [es-node121] collector [cluster_stats] timed out when collecting data: node [LHj9iH-CTBesKk199fQHdA] did not respond within [10s]

[2023-04-28T00:31:22,497][ERROR][o.e.x.m.c.c.ClusterStatsCollector] [es-node121] collector [cluster_stats] timed out when collecting data: node [LHj9iH-CTBesKk199fQHdA] did not respond within [10s]

[2023-04-28T00:32:12,531][ERROR][o.e.x.m.c.c.ClusterStatsCollector] [es-node121] collector [cluster_stats] timed out when collecting data: node [LHj9iH-CTBesKk199fQHdA] did not respond within [10s]

[2023-04-28T00:32:42,540][ERROR][o.e.x.m.c.c.ClusterStatsCollector] [es-node121] collector [cluster_stats] timed out when collecting data: node [LHj9iH-CTBesKk199fQHdA] did not respond within [10s]

[2023-04-28T00:33:22,562][ERROR][o.e.x.m.c.c.ClusterStatsCollector] [es-node121] collector [cluster_stats] timed out when collecting data: node [LHj9iH-CTBesKk199fQHdA] did not respond within [10s]

[2023-04-28T00:35:14,482][ERROR][o.e.x.m.c.i.IndexRecoveryCollector] [es-node121] collector [index_recovery] timed out when collecting data: node [LHj9iH-CTBesKk199fQHdA] did not respond within [10s]

[2023-04-28T00:45:03,095][ERROR][o.e.x.m.c.c.ClusterStatsCollector] [es-node121] collector [cluster_stats] timed out when collecting data: node [LHj9iH-CTBesKk199fQHdA] did not respond within [10s]

[2023-04-28T00:45:23,124][ERROR][o.e.x.m.c.c.ClusterStatsCollector] [es-node121] collector [cluster_stats] timed out when collecting data: node [LHj9iH-CTBesKk199fQHdA] did not respond within [10s]

[2023-04-28T00:55:33,737][ERROR][o.e.x.m.c.c.ClusterStatsCollector] [es-node121] collector [cluster_stats] timed out when collecting data: node [LHj9iH-CTBesKk199fQHdA] did not respond within [10s]

[2023-04-28T01:02:54,228][ERROR][o.e.x.m.c.c.ClusterStatsCollector] [es-node121] collector [cluster_stats] timed out when collecting data: node [LHj9iH-CTBesKk199fQHdA] did not respond within [10s]

[2023-04-28T01:26:17,494][ERROR][o.e.x.m.c.c.ClusterStatsCollector] [es-node121] collector [cluster_stats] timed out when collecting data: node [LHj9iH-CTBesKk199fQHdA] did not respond within [10s]

[2023-04-28T01:29:27,854][ERROR][o.e.x.m.c.c.ClusterStatsCollector] [es-node121] collector [cluster_stats] timed out when collecting data: node [LHj9iH-CTBesKk199fQHdA] did not respond within [10s]

[2023-04-28T01:34:28,361][ERROR][o.e.x.m.c.c.ClusterStatsCollector] [es-node121] collector [cluster_stats] timed out when collecting data: node [LHj9iH-CTBesKk199fQHdA] did not respond within [10s]

[2023-04-28T01:44:09,907][ERROR][o.e.x.m.c.c.ClusterStatsCollector] [es-node121] collector [cluster_stats] timed out when collecting data: node [LHj9iH-CTBesKk199fQHdA] did not respond within [10s]

[2023-04-28T01:47:20,365][ERROR][o.e.x.m.c.c.ClusterStatsCollector] [es-node121] collector [cluster_stats] timed out when collecting data: node [LHj9iH-CTBesKk199fQHdA] did not respond within [10s]

[2023-04-28T01:55:21,755][ERROR][o.e.x.m.c.c.ClusterStatsCollector] [es-node121] collector [cluster_stats] timed out when collecting data: node [LHj9iH-CTBesKk199fQHdA] did not respond within [10s]

[2023-04-28T02:00:52,357][ERROR][o.e.x.m.c.c.ClusterStatsCollector] [es-node121] collector [cluster_stats] timed out when collecting data: node [LHj9iH-CTBesKk199fQHdA] did not respond within [10s]

[2023-04-28T02:38:17,651][ERROR][o.e.x.m.c.i.IndexRecoveryCollector] [es-node121] collector [index_recovery] timed out when collecting data: node [LHj9iH-CTBesKk199fQHdA] did not respond within [10s]

[2023-04-28T02:55:08,717][ERROR][o.e.x.m.c.c.ClusterStatsCollector] [es-node121] collector [cluster_stats] timed out when collecting data: node [LHj9iH-CTBesKk199fQHdA] did not respond within [10s]

[2023-04-28T03:35:55,146][ERROR][o.e.x.m.c.c.ClusterStatsCollector] [es-node121] collector [cluster_stats] timed out when collecting data: node [LHj9iH-CTBesKk199fQHdA] did not respond within [10s]

[2023-04-28T03:47:17,342][ERROR][o.e.x.m.c.i.IndexRecoveryCollector] [es-node121] collector [index_recovery] timed out when collecting data: node [LHj9iH-CTBesKk199fQHdA] did not respond within [10s]

[2023-04-28T03:50:27,094][ERROR][o.e.x.m.c.c.ClusterStatsCollector] [es-node121] collector [cluster_stats] timed out when collecting data: node [LHj9iH-CTBesKk199fQHdA] did not respond within [10s]

[2023-04-28T05:07:06,881][ERROR][o.e.x.m.c.c.ClusterStatsCollector] [es-node121] collector [cluster_stats] timed out when collecting data: node [LHj9iH-CTBesKk199fQHdA] did not respond within [10s]

[2023-04-28T05:30:39,618][ERROR][o.e.x.m.c.c.ClusterStatsCollector] [es-node121] collector [cluster_stats] timed out when collecting data: node [LHj9iH-CTBesKk199fQHdA] did not respond within [10s]

[2023-04-28T05:33:19,931][ERROR][o.e.x.m.c.c.ClusterStatsCollector] [es-node121] collector [cluster_stats] timed out when collecting data: node [LHj9iH-CTBesKk199fQHdA] did not respond within [10s]

[2023-04-28T05:37:30,332][ERROR][o.e.x.m.c.c.ClusterStatsCollector] [es-node121] collector [cluster_stats] timed out when collecting data: node [LHj9iH-CTBesKk199fQHdA] did not respond within [10s]

[2023-04-28T06:35:08,402][ERROR][o.e.x.m.c.c.ClusterStatsCollector] [es-node121] collector [cluster_stats] timed out when collecting data: node [LHj9iH-CTBesKk199fQHdA] did not respond within [10s]

WARN


[2023-04-28T00:04:02,217][WARN ][o.e.t.TransportService ] [es-node121] Received response for a request that has timed out, sent [11s/11061ms] ago, timed out [1.1s/1132ms] ago, action [indices:monitor/recovery[n]], node [{es-node120}{LHj9iH-CTBesKk199fQHdA}{Hm_ohKVwQzO8muJEgvzKDw}{es-node120}{192.168.1.120}{192.168.1.120:9300}{cdfhilmrstw}{8.7.0}{ml.allocated_processors_double=10.0, xpack.installed=true, ml.machine_memory=11477852160, ml.allocated_processors=10, ml.max_jvm_size=5742002176}], id [8893742]

[2023-04-28T00:04:38,077][WARN ][o.e.m.j.JvmGcMonitorService] [es-node121] [gc][640790] overhead, spent [674ms] collecting in the last [1s]

[2023-04-28T00:09:11,442][WARN ][o.e.t.TransportService ] [es-node121] Received response for a request that has timed out, sent [19.9s/19901ms] ago, timed out [9.8s/9808ms] ago, action [cluster:monitor/stats[n]], node [{es-node120}{LHj9iH-CTBesKk199fQHdA}{Hm_ohKVwQzO8muJEgvzKDw}{es-node120}{192.168.1.120}{192.168.1.120:9300}{cdfhilmrstw}{8.7.0}{ml.allocated_processors_double=10.0, xpack.installed=true, ml.machine_memory=11477852160, ml.allocated_processors=10, ml.max_jvm_size=5742002176}], id [8897168]

[2023-04-28T00:09:17,934][WARN ][o.e.t.TransportService ] [es-node121] Received response for a request that has timed out, sent [16.2s/16229ms] ago, timed out [6.2s/6212ms] ago, action [indices:monitor/recovery[n]], node [{es-node120}{LHj9iH-CTBesKk199fQHdA}{Hm_ohKVwQzO8muJEgvzKDw}{es-node120}{192.168.1.120}{192.168.1.120:9300}{cdfhilmrstw}{8.7.0}{ml.allocated_processors_double=10.0, xpack.installed=true, ml.machine_memory=11477852160, ml.allocated_processors=10, ml.max_jvm_size=5742002176}], id [8897222]

[2023-04-28T00:11:32,277][WARN ][o.e.t.TransportService ] [es-node121] Received response for a request that has timed out, sent [10.6s/10606ms] ago, timed out [629ms/629ms] ago, action [cluster:monitor/stats[n]], node [{es-node120}{LHj9iH-CTBesKk199fQHdA}{Hm_ohKVwQzO8muJEgvzKDw}{es-node120}{192.168.1.120}{192.168.1.120:9300}{cdfhilmrstw}{8.7.0}{ml.allocated_processors_double=10.0, xpack.installed=true, ml.machine_memory=11477852160, ml.allocated_processors=10, ml.max_jvm_size=5742002176}], id [8898776]

[2023-04-28T00:13:38,539][WARN ][o.e.c.r.a.AllocationService] [es-node121] [firewall-2023.04.16][0] marking unavailable shards as stale: [3qtpYbc6TbiKhQMUWaGzJA]

[2023-04-28T00:14:00,151][WARN ][o.e.c.r.a.AllocationService] [es-node121] [.internal.alerts-security.alerts-default-000002][0] marking unavailable shards as stale: [m4T5zlUPQYihWTX4b0XAdw]

[2023-04-28T00:14:28,520][WARN ][o.e.t.TransportService ] [es-node121] Received response for a request that has timed out, sent [16.6s/16691ms] ago, timed out [6.6s/6628ms] ago, action [cluster:monitor/stats[n]], node [{es-node120}{LHj9iH-CTBesKk199fQHdA}{Hm_ohKVwQzO8muJEgvzKDw}{es-node120}{192.168.1.120}{192.168.1.120:9300}{cdfhilmrstw}{8.7.0}{ml.allocated_processors_double=10.0, xpack.installed=true, ml.machine_memory=11477852160, ml.allocated_processors=10, ml.max_jvm_size=5742002176}], id [8900813]

[2023-04-28T00:18:53,008][WARN ][o.e.t.TransportService ] [es-node121] Received response for a request that has timed out, sent [10.9s/10924ms] ago, timed out [933ms/933ms] ago, action [cluster:monitor/stats[n]], node [{es-node120}{LHj9iH-CTBesKk199fQHdA}{Hm_ohKVwQzO8muJEgvzKDw}{es-node120}{192.168.1.120}{192.168.1.120:9300}{cdfhilmrstw}{8.7.0}{ml.allocated_processors_double=10.0, xpack.installed=true, ml.machine_memory=11477852160, ml.allocated_processors=10, ml.max_jvm_size=5742002176}], id [8903910]

[2023-04-28T00:21:43,597][WARN ][o.e.t.TransportService ] [es-node121] Received response for a request that has timed out, sent [11.6s/11642ms] ago, timed out [1.6s/1625ms] ago, action [cluster:monitor/stats[n]], node [{es-node120}{LHj9iH-CTBesKk199fQHdA}{Hm_ohKVwQzO8muJEgvzKDw}{es-node120}{192.168.1.120}{192.168.1.120:9300}{cdfhilmrstw}{8.7.0}{ml.allocated_processors_double=10.0, xpack.installed=true, ml.machine_memory=11477852160, ml.allocated_processors=10, ml.max_jvm_size=5742002176}], id [8905780]

[2023-04-28T00:25:22,785][WARN ][o.e.t.TransportService ] [es-node121] Received response for a request that has timed out, sent [10.7s/10770ms] ago, timed out [607ms/607ms] ago, action [cluster:monitor/stats[n]], node [{es-node120}{LHj9iH-CTBesKk199fQHdA}{Hm_ohKVwQzO8muJEgvzKDw}{es-node120}{192.168.1.120}{192.168.1.120:9300}{cdfhilmrstw}{8.7.0}{ml.allocated_processors_double=10.0, xpack.installed=true, ml.machine_memory=11477852160, ml.allocated_processors=10, ml.max_jvm_size=5742002176}], id [8908324]

[2023-04-28T00:27:28,866][WARN ][o.e.t.TransportService ] [es-node121] Received response for a request that has timed out, sent [16.7s/16723ms] ago, timed out [6.5s/6567ms] ago, action [cluster:monitor/stats[n]], node [{es-node120}{LHj9iH-CTBesKk199fQHdA}{Hm_ohKVwQzO8muJEgvzKDw}{es-node120}{192.168.1.120}{192.168.1.120:9300}{cdfhilmrstw}{8.7.0}{ml.allocated_processors_double=10.0, xpack.installed=true, ml.machine_memory=11477852160, ml.allocated_processors=10, ml.max_jvm_size=5742002176}], id [8909707]

[2023-04-28T00:30:09,163][WARN ][o.e.c.r.a.AllocationService] [es-node121] [firewall-2023.04.17][0] marking unavailable shards as stale: [KSPXN7khQ_i3tzwlXyUBjg]

[2023-04-28T00:30:42,354][WARN ][o.e.c.r.a.AllocationService] [es-node121] [admin_regions_lvl2_v2][0] marking unavailable shards as stale: [Kfw1vUjqRkCmjQATZ9J2Vw]

[2023-04-28T00:31:23,644][WARN ][o.e.t.TransportService ] [es-node121] Received response for a request that has timed out, sent [11.3s/11333ms] ago, timed out [1.3s/1307ms] ago, action [cluster:monitor/stats[n]], node [{es-node120}{LHj9iH-CTBesKk199fQHdA}{Hm_ohKVwQzO8muJEgvzKDw}{es-node120}{192.168.1.120}{192.168.1.120:9300}{cdfhilmrstw}{8.7.0}{ml.allocated_processors_double=10.0, xpack.installed=true, ml.machine_memory=11477852160, ml.allocated_processors=10, ml.max_jvm_size=5742002176}], id [8912461]

[2023-04-28T00:31:51,062][WARN ][o.e.c.r.a.AllocationService] [es-node121] [world_map][0] marking unavailable shards as stale: [9oF8ed3qSwyJLlBVu_KU0A]

[2023-04-28T00:32:13,992][WARN ][o.e.t.TransportService ] [es-node121] Received response for a request that has timed out, sent [11.5s/11583ms] ago, timed out [1.4s/1436ms] ago, action [cluster:monitor/stats[n]], node [{es-node120}{LHj9iH-CTBesKk199fQHdA}{Hm_ohKVwQzO8muJEgvzKDw}{es-node120}{192.168.1.120}{192.168.1.120:9300}{cdfhilmrstw}{8.7.0}{ml.allocated_processors_double=10.0, xpack.installed=true, ml.machine_memory=11477852160, ml.allocated_processors=10, ml.max_jvm_size=5742002176}], id [8912997]

[2023-04-28T00:32:20,448][WARN ][o.e.c.r.a.AllocationService] [es-node121] [.metrics-endpoint.metadata_united_default][0] marking unavailable shards as stale: [yeuNzJmbSzmJE4MPzvcS_A]

[2023-04-28T00:32:44,762][WARN ][o.e.t.TransportService ] [es-node121] Received response for a request that has timed out, sent [12.3s/12380ms] ago, timed out [2.3s/2339ms] ago, action [cluster:monitor/stats[n]], node [{es-node120}{LHj9iH-CTBesKk199fQHdA}{Hm_ohKVwQzO8muJEgvzKDw}{es-node120}{192.168.1.120}{192.168.1.120:9300}{cdfhilmrstw}{8.7.0}{ml.allocated_processors_double=10.0, xpack.installed=true, ml.machine_memory=11477852160, ml.allocated_processors=10, ml.max_jvm_size=5742002176}], id [8913271]

[2023-04-28T00:33:03,772][WARN ][o.e.c.r.a.AllocationService] [es-node121] [.fleet-files-endpoint-000001][0] marking unavailable shards as stale: [YlTueFo_R1WXk84S3dbT4g]

[2023-04-28T00:33:24,902][WARN ][o.e.t.TransportService ] [es-node121] Received response for a request that has timed out, sent [12.4s/12492ms] ago, timed out [2.3s/2357ms] ago, action [cluster:monitor/stats[n]], node [{es-node120}{LHj9iH-CTBesKk199fQHdA}{Hm_ohKVwQzO8muJEgvzKDw}{es-node120}{192.168.1.120}{192.168.1.120:9300}{cdfhilmrstw}{8.7.0}{ml.allocated_processors_double=10.0, xpack.installed=true, ml.machine_memory=11477852160, ml.allocated_processors=10, ml.max_jvm_size=5742002176}], id [8913633]

[2023-04-28T00:33:50,036][WARN ][o.e.c.r.a.AllocationService] [es-node121] [indicators-29032023_1][0] marking unavailable shards as stale: [27xh1i9iSZ2SfSdG9Ny5_g]

[2023-04-28T00:34:31,782][WARN ][o.e.c.r.a.AllocationService] [es-node121] [.ds-.logs-deprecation.elasticsearch-default-2023.03.25-000002][0] marking unavailable shards as stale: [yJI6RTv9SPqnhQJSpxgwig]

[2023-04-28T00:34:54,965][WARN ][o.e.c.r.a.AllocationService] [es-node121] [.internal.alerts-security.alerts-default-000001][0] marking unavailable shards as stale: [PXkKhiX9SBe2qAmC_UFURA]

[2023-04-28T00:35:15,653][WARN ][o.e.t.TransportService ] [es-node121] Received response for a request that has timed out, sent [11.1s/11111ms] ago, timed out [1.1s/1122ms] ago, action [indices:monitor/recovery[n]], node [{es-node120}{LHj9iH-CTBesKk199fQHdA}{Hm_ohKVwQzO8muJEgvzKDw}{es-node120}{192.168.1.120}{192.168.1.120:9300}{cdfhilmrstw}{8.7.0}{ml.allocated_processors_double=10.0, xpack.installed=true, ml.machine_memory=11477852160, ml.allocated_processors=10, ml.max_jvm_size=5742002176}], id [8914782]

[2023-04-28T00:45:03,618][WARN ][o.e.t.TransportService ] [es-node121] Received response for a request that has timed out, sent [10.5s/10564ms] ago, timed out [402ms/402ms] ago, action [cluster:monitor/stats[n]], node [{es-node120}{LHj9iH-CTBesKk199fQHdA}{Hm_ohKVwQzO8muJEgvzKDw}{es-node120}{192.168.1.120}{192.168.1.120:9300}{cdfhilmrstw}{8.7.0}{ml.allocated_processors_double=10.0, xpack.installed=true, ml.machine_memory=11477852160, ml.allocated_processors=10, ml.max_jvm_size=5742002176}], id [8921794]

[2023-04-28T00:45:23,912][WARN ][o.e.t.TransportService ] [es-node121] Received response for a request that has timed out, sent [10.8s/10863ms] ago, timed out [812ms/812ms] ago, action [cluster:monitor/stats[n]], node [{es-node120}{LHj9iH-CTBesKk199fQHdA}{Hm_ohKVwQzO8muJEgvzKDw}{es-node120}{192.168.1.120}{192.168.1.120:9300}{cdfhilmrstw}{8.7.0}{ml.allocated_processors_double=10.0, xpack.installed=true, ml.machine_memory=11477852160, ml.allocated_processors=10, ml.max_jvm_size=5742002176}], id [8921957]

[2023-04-28T00:55:35,542][WARN ][o.e.t.TransportService ] [es-node121] Received response for a request that has timed out, sent [11.7s/11723ms] ago, timed out [1.7s/1709ms] ago, action [cluster:monitor/stats[n]], node [{es-node120}{LHj9iH-CTBesKk199fQHdA}{Hm_ohKVwQzO8muJEgvzKDw}{es-node120}{192.168.1.120}{192.168.1.120:9300}{cdfhilmrstw}{8.7.0}{ml.allocated_processors_double=10.0, xpack.installed=true, ml.machine_memory=11477852160, ml.allocated_processors=10, ml.max_jvm_size=5742002176}], id [8929133]

[2023-04-28T01:01:58,932][WARN ][o.e.c.r.a.AllocationService] [es-node121] [firewall-2023.04.13][0] marking unavailable shards as stale: [zsUKGNvnTm-RXESlT0qsSw]

[2023-04-28T01:02:55,694][WARN ][o.e.t.TransportService ] [es-node121] Received response for a request that has timed out, sent [11.3s/11307ms] ago, timed out [1.3s/1336ms] ago, action [cluster:monitor/stats[n]], node [{es-node120}{LHj9iH-CTBesKk199fQHdA}{Hm_ohKVwQzO8muJEgvzKDw}{es-node120}{192.168.1.120}{192.168.1.120:9300}{cdfhilmrstw}{8.7.0}{ml.allocated_processors_double=10.0, xpack.installed=true, ml.machine_memory=11477852160, ml.allocated_processors=10, ml.max_jvm_size=5742002176}], id [8934247]

[2023-04-28T01:26:18,177][WARN ][o.e.t.TransportService ] [es-node121] Received response for a request that has timed out, sent [10.6s/10692ms] ago, timed out [635ms/635ms] ago, action [cluster:monitor/stats[n]], node [{es-node120}{LHj9iH-CTBesKk199fQHdA}{Hm_ohKVwQzO8muJEgvzKDw}{es-node120}{192.168.1.120}{192.168.1.120:9300}{cdfhilmrstw}{8.7.0}{ml.allocated_processors_double=10.0, xpack.installed=true, ml.machine_memory=11477852160, ml.allocated_processors=10, ml.max_jvm_size=5742002176}], id [8951734]

[2023-04-28T01:29:29,294][WARN ][o.e.t.TransportService ] [es-node121] Received response for a request that has timed out, sent [11.4s/11437ms] ago, timed out [1.4s/1436ms] ago, action [cluster:monitor/stats[n]], node [{es-node120}{LHj9iH-CTBesKk199fQHdA}{Hm_ohKVwQzO8muJEgvzKDw}{es-node120}{192.168.1.120}{192.168.1.120:9300}{cdfhilmrstw}{8.7.0}{ml.allocated_processors_double=10.0, xpack.installed=true, ml.machine_memory=11477852160, ml.allocated_processors=10, ml.max_jvm_size=5742002176}], id [8953997]

[2023-04-28T01:34:30,799][WARN ][o.e.t.TransportService ] [es-node121] Received response for a request that has timed out, sent [12.4s/12412ms] ago, timed out [2.4s/2452ms] ago, action [cluster:monitor/stats[n]], node [{es-node120}{LHj9iH-CTBesKk199fQHdA}{Hm_ohKVwQzO8muJEgvzKDw}{es-node120}{192.168.1.120}{192.168.1.120:9300}{cdfhilmrstw}{8.7.0}{ml.allocated_processors_double=10.0, xpack.installed=true, ml.machine_memory=11477852160, ml.allocated_processors=10, ml.max_jvm_size=5742002176}], id [8957642]

[2023-04-28T01:44:11,349][WARN ][o.e.t.TransportService ] [es-node121] Received response for a request that has timed out, sent [11.5s/11592ms] ago, timed out [1.5s/1578ms] ago, action [cluster:monitor/stats[n]], node [{es-node120}{LHj9iH-CTBesKk199fQHdA}{Hm_ohKVwQzO8muJEgvzKDw}{es-node120}{192.168.1.120}{192.168.1.120:9300}{cdfhilmrstw}{8.7.0}{ml.allocated_processors_double=10.0, xpack.installed=true, ml.machine_memory=11477852160, ml.allocated_processors=10, ml.max_jvm_size=5742002176}], id [8964790]

[2023-04-28T01:47:20,869][WARN ][o.e.t.TransportService ] [es-node121] Received response for a request that has timed out, sent [10.4s/10470ms] ago, timed out [442ms/442ms] ago, action [cluster:monitor/stats[n]], node [{es-node120}{LHj9iH-CTBesKk199fQHdA}{Hm_ohKVwQzO8muJEgvzKDw}{es-node120}{192.168.1.120}{192.168.1.120:9300}{cdfhilmrstw}{8.7.0}{ml.allocated_processors_double=10.0, xpack.installed=true, ml.machine_memory=11477852160, ml.allocated_processors=10, ml.max_jvm_size=5742002176}], id [8967044]

[2023-04-28T01:55:26,336][WARN ][o.e.t.TransportService ] [es-node121] Received response for a request that has timed out, sent [14.6s/14682ms] ago, timed out [4.4s/4472ms] ago, action [cluster:monitor/stats[n]], node [{es-node120}{LHj9iH-CTBesKk199fQHdA}{Hm_ohKVwQzO8muJEgvzKDw}{es-node120}{192.168.1.120}{192.168.1.120:9300}{cdfhilmrstw}{8.7.0}{ml.allocated_processors_double=10.0, xpack.installed=true, ml.machine_memory=11477852160, ml.allocated_processors=10, ml.max_jvm_size=5742002176}], id [8972999]

[2023-04-28T02:00:54,597][WARN ][o.e.t.TransportService ] [es-node121] Received response for a request that has timed out, sent [12.2s/12280ms] ago, timed out [2.2s/2267ms] ago, action [cluster:monitor/stats[n]], node [{es-node120}{LHj9iH-CTBesKk199fQHdA}{Hm_ohKVwQzO8muJEgvzKDw}{es-node120}{192.168.1.120}{192.168.1.120:9300}{cdfhilmrstw}{8.7.0}{ml.allocated_processors_double=10.0, xpack.installed=true, ml.machine_memory=11477852160, ml.allocated_processors=10, ml.max_jvm_size=5742002176}], id [8977069]

[2023-04-28T02:38:21,185][WARN ][o.e.t.TransportService ] [es-node121] Received response for a request that has timed out, sent [13.5s/13551ms] ago, timed out [3.5s/3512ms] ago, action [indices:monitor/recovery[n]], node [{es-node120}{LHj9iH-CTBesKk199fQHdA}{Hm_ohKVwQzO8muJEgvzKDw}{es-node120}{192.168.1.120}{192.168.1.120:9300}{cdfhilmrstw}{8.7.0}{ml.allocated_processors_double=10.0, xpack.installed=true, ml.machine_memory=11477852160, ml.allocated_processors=10, ml.max_jvm_size=5742002176}], id [9004840]

[2023-04-28T02:55:09,427][WARN ][o.e.t.TransportService ] [es-node121] Received response for a request that has timed out, sent [10.6s/10699ms] ago, timed out [643ms/643ms] ago, action [cluster:monitor/stats[n]], node [{es-node120}{LHj9iH-CTBesKk199fQHdA}{Hm_ohKVwQzO8muJEgvzKDw}{es-node120}{192.168.1.120}{192.168.1.120:9300}{cdfhilmrstw}{8.7.0}{ml.allocated_processors_double=10.0, xpack.installed=true, ml.machine_memory=11477852160, ml.allocated_processors=10, ml.max_jvm_size=5742002176}], id [9017307]

[2023-04-28T03:35:56,912][WARN ][o.e.t.TransportService ] [es-node121] Received response for a request that has timed out, sent [11.5s/11588ms] ago, timed out [1.6s/1687ms] ago, action [cluster:monitor/stats[n]], node [{es-node120}{LHj9iH-CTBesKk199fQHdA}{Hm_ohKVwQzO8muJEgvzKDw}{es-node120}{192.168.1.120}{192.168.1.120:9300}{cdfhilmrstw}{8.7.0}{ml.allocated_processors_double=10.0, xpack.installed=true, ml.machine_memory=11477852160, ml.allocated_processors=10, ml.max_jvm_size=5742002176}], id [9047555]

[2023-04-28T03:47:18,436][WARN ][o.e.t.TransportService ] [es-node121] Received response for a request that has timed out, sent [11.2s/11227ms] ago, timed out [1s/1080ms] ago, action [indices:monitor/recovery[n]], node [{es-node120}{LHj9iH-CTBesKk199fQHdA}{Hm_ohKVwQzO8muJEgvzKDw}{es-node120}{192.168.1.120}{192.168.1.120:9300}{cdfhilmrstw}{8.7.0}{ml.allocated_processors_double=10.0, xpack.installed=true, ml.machine_memory=11477852160, ml.allocated_processors=10, ml.max_jvm_size=5742002176}], id [9056023]

[2023-04-28T03:50:30,175][WARN ][o.e.t.TransportService ] [es-node121] Received response for a request that has timed out, sent [13.1s/13115ms] ago, timed out [3s/3097ms] ago, action [cluster:monitor/stats[n]], node [{es-node120}{LHj9iH-CTBesKk199fQHdA}{Hm_ohKVwQzO8muJEgvzKDw}{es-node120}{192.168.1.120}{192.168.1.120:9300}{cdfhilmrstw}{8.7.0}{ml.allocated_processors_double=10.0, xpack.installed=true, ml.machine_memory=11477852160, ml.allocated_processors=10, ml.max_jvm_size=5742002176}], id [9058360]

[2023-04-28T05:07:12,138][WARN ][o.e.t.TransportService ] [es-node121] Received response for a request that has timed out, sent [15.3s/15358ms] ago, timed out [5.3s/5321ms] ago, action [cluster:monitor/stats[n]], node [{es-node120}{LHj9iH-CTBesKk199fQHdA}{Hm_ohKVwQzO8muJEgvzKDw}{es-node120}{192.168.1.120}{192.168.1.120:9300}{cdfhilmrstw}{8.7.0}{ml.allocated_processors_double=10.0, xpack.installed=true, ml.machine_memory=11477852160, ml.allocated_processors=10, ml.max_jvm_size=5742002176}], id [9115484]

[2023-04-28T05:30:41,369][WARN ][o.e.t.TransportService ] [es-node121] Received response for a request that has timed out, sent [11.7s/11795ms] ago, timed out [1.7s/1769ms] ago, action [cluster:monitor/stats[n]], node [{es-node120}{LHj9iH-CTBesKk199fQHdA}{Hm_ohKVwQzO8muJEgvzKDw}{es-node120}{192.168.1.120}{192.168.1.120:9300}{cdfhilmrstw}{8.7.0}{ml.allocated_processors_double=10.0, xpack.installed=true, ml.machine_memory=11477852160, ml.allocated_processors=10, ml.max_jvm_size=5742002176}], id [9132816]

[2023-04-28T05:33:25,900][WARN ][o.e.t.TransportService ] [es-node121] Received response for a request that has timed out, sent [16s/16039ms] ago, timed out [5.9s/5939ms] ago, action [cluster:monitor/stats[n]], node [{es-node120}{LHj9iH-CTBesKk199fQHdA}{Hm_ohKVwQzO8muJEgvzKDw}{es-node120}{192.168.1.120}{192.168.1.120:9300}{cdfhilmrstw}{8.7.0}{ml.allocated_processors_double=10.0, xpack.installed=true, ml.machine_memory=11477852160, ml.allocated_processors=10, ml.max_jvm_size=5742002176}], id [9134618]

[2023-04-28T05:37:35,064][WARN ][o.e.t.TransportService ] [es-node121] Received response for a request that has timed out, sent [14.6s/14686ms] ago, timed out [4.6s/4610ms] ago, action [cluster:monitor/stats[n]], node [{es-node120}{LHj9iH-CTBesKk199fQHdA}{Hm_ohKVwQzO8muJEgvzKDw}{es-node120}{192.168.1.120}{192.168.1.120:9300}{cdfhilmrstw}{8.7.0}{ml.allocated_processors_double=10.0, xpack.installed=true, ml.machine_memory=11477852160, ml.allocated_processors=10, ml.max_jvm_size=5742002176}], id [9137522]

[2023-04-28T06:35:10,368][WARN ][o.e.t.TransportService ] [es-node121] Received response for a request that has timed out, sent [11.9s/11978ms] ago, timed out [2s/2040ms] ago, action [cluster:monitor/stats[n]], node [{es-node120}{LHj9iH-CTBesKk199fQHdA}{Hm_ohKVwQzO8muJEgvzKDw}{es-node120}{192.168.1.120}{192.168.1.120:9300}{cdfhilmrstw}{8.7.0}{ml.allocated_processors_double=10.0, xpack.installed=true, ml.machine_memory=11477852160, ml.allocated_processors=10, ml.max_jvm_size=5742002176}], id [9178981]

The strange thing about these messages is that they appear even at odd hours when the indexing/log rate is low. Peak log rate hovers around 1000-1200/s. The errors appearing at odd hours makes me wonder if it really is that the nodes are running out of RAM or the cause could be something else.

As a part of troubleshooting we have tried to increase the RAM on one of the VMs to 12GB, it didn't have any positive impact.

What else can be tried?

What are the resourcs of the host? And what are you using to virtualized the VMs?

Host config - i7 12700T, 16GB RAM, 500GB M3 NVMe

Why VMs? - we are trying to get a better understanding of the hardware requirements before procuring dedicated hardware.

Do you have all these nodes running as VMs on a single host?

That means a total of 24 GB RAM.

If it is indeed running on a single host it would seem you are swapping memory to disk, which will kill performance. Elasticsearch expects to have full access to all configured resources (both CPU cores and RAM).

Your host has only 16 GB of memory, but you are creating 3 VMs with 8 GB, which will need a total of 24 GB, more than what your host has, and the host operating system and the hypervisor will also need memory.

You are overcommiting the memory, which can impact performance as some of the memory is swapped to disk which is already pretty bad for elasticsearch.

I don't think that there is anything you can do on Elasticsearch to deal with it, the main issue is that you do not have enough resources at the moment.

The three nodes are on three different hosts. Each host has 16GB RAM, i7 & 500 GB SDD

Is there anythig else running on the hosts consuming resources?

Host 1 has ES and Filebeat

Host 2 & 3 has just ES,

we recently moved one ES instance to another Host which is also running Logstash just to make sure it wasn’t a hardware issue.

Is there anything in the logs about long and/or frequent GC?

Which version of Elasticsearch are you running?

We are running version 8.7.0

How often would be considered too frequent when it comes to GC being called up?

The setup is as follows

FW —> FileBeat —> Logstash —> 3 Node ES Cluster (with one of the nodes having Kibana installed)

Logs related to GC calls from last Friday. We faced issues with the interface being unresponsive and there being frequent breaks in indexing.

[2023-04-28T00:04:38,077][WARN ][o.e.m.j.JvmGcMonitorService] [es-node121] [gc][640790] overhead, spent [674ms] collecting in the last [1s]
[2023-04-28T11:06:11,222][INFO ][o.e.m.j.JvmGcMonitorService] [es-node121] [gc][679788] overhead, spent [465ms] collecting in the last [1.1s]
[2023-04-28T11:06:19,275][INFO ][o.e.m.j.JvmGcMonitorService] [es-node121] [gc][679796] overhead, spent [300ms] collecting in the last [1s]
[2023-04-28T11:13:29,041][INFO ][o.e.m.j.JvmGcMonitorService] [es-node121] [gc][young][680222][5426] duration [883ms], collections [1]/[1s], total [883ms]/[4.5m], memory [1gb]->[671.6mb]/[3.8gb], all_pools {[young] [164mb]->[4mb]/[0b]}{[old] [839.5mb]->[656mb]/[3.8gb]}{[survivor] [22.6mb]->[11.6mb]/[0b]}
[2023-04-28T11:13:29,041][WARN ][o.e.m.j.JvmGcMonitorService] [es-node121] [gc][680222] overhead, spent [883ms] collecting in the last [1s]
[2023-04-28T11:18:21,022][INFO ][o.e.m.j.JvmGcMonitorService] [es-node121] [gc][680512] overhead, spent [482ms] collecting in the last [1s]
[2023-04-28T11:18:22,346][INFO ][o.e.m.j.JvmGcMonitorService] [es-node121] [gc][young][680513][5437] duration [840ms], collections [1]/[1.3s], total [840ms]/[4.5m], memory [843.9mb]->[797.5mb]/[3.8gb], all_pools {[young] [56mb]->[0b]/[0b]}{[old] [656mb]->[781.5mb]/[3.8gb]}{[survivor] [131.8mb]->[16mb]/[0b]}
[2023-04-28T11:18:22,346][WARN ][o.e.m.j.JvmGcMonitorService] [es-node121] [gc][680513] overhead, spent [840ms] collecting in the last [1.3s]
[2023-04-28T11:24:43,348][INFO ][o.e.m.j.JvmGcMonitorService] [es-node121] [gc][680891] overhead, spent [291ms] collecting in the last [1s]
[2023-04-28T11:25:05,241][WARN ][o.e.m.j.JvmGcMonitorService] [es-node121] [gc][young][680912][5450] duration [1.2s], collections [1]/[1.8s], total [1.2s]/[4.6m], memory [1.6gb]->[1gb]/[3.8gb], all_pools {[young] [656mb]->[0b]/[0b]}{[old] [875.7mb]->[1009.5mb]/[3.8gb]}{[survivor] [170mb]->[32mb]/[0b]}
[2023-04-28T11:25:05,241][WARN ][o.e.m.j.JvmGcMonitorService] [es-node121] [gc][680912] overhead, spent [1.2s] collecting in the last [1.8s]
[2023-04-28T11:25:15,290][WARN ][o.e.m.j.JvmGcMonitorService] [es-node121] [gc][680922] overhead, spent [603ms] collecting in the last [1s]
[2023-04-28T11:26:53,891][INFO ][o.e.m.j.JvmGcMonitorService] [es-node121] [gc][young][681019][5460] duration [870ms], collections [1]/[1.6s], total [870ms]/[4.6m], memory [1.2gb]->[1.1gb]/[3.8gb], all_pools {[young] [180mb]->[0b]/[0b]}{[old] [1gb]->[1.1gb]/[3.8gb]}{[survivor] [72mb]->[11mb]/[0b]}
[2023-04-28T11:26:53,891][WARN ][o.e.m.j.JvmGcMonitorService] [es-node121] [gc][681019] overhead, spent [870ms] collecting in the last [1.6s]
[2023-04-28T11:27:35,432][WARN ][o.e.m.j.JvmGcMonitorService] [es-node121] [gc][681060] overhead, spent [1s] collecting in the last [1.3s]
[2023-04-28T11:39:28,279][INFO ][o.e.m.j.JvmGcMonitorService] [es-node121] [gc][681766] overhead, spent [259ms] collecting in the last [1s]
[2023-04-28T11:44:07,948][WARN ][o.e.m.j.JvmGcMonitorService] [es-node121] [gc][682040] overhead, spent [1s] collecting in the last [1.6s]
[2023-04-28T11:47:13,991][INFO ][o.e.m.j.JvmGcMonitorService] [es-node121] [gc][682225] overhead, spent [423ms] collecting in the last [1s]
[2023-04-28T11:55:31,938][INFO ][o.e.m.j.JvmGcMonitorService] [es-node121] [gc][682719] overhead, spent [337ms] collecting in the last [1s]
[2023-04-28T13:11:03,856][INFO ][o.e.m.j.JvmGcMonitorService] [es-node121] [gc][687202] overhead, spent [492ms] collecting in the last [1s]
[2023-04-28T13:51:16,382][WARN ][o.e.m.j.JvmGcMonitorService] [es-node121] [gc][young][689586][5780] duration [1.7s], collections [1]/[2.4s], total [1.7s]/[4.9m], memory [2.9gb]->[702.4mb]/[3.8gb], all_pools {[young] [2.2gb]->[0b]/[0b]}{[old] [676.3mb]->[676.6mb]/[3.8gb]}{[survivor] [19.4mb]->[25.7mb]/[0b]}
[2023-04-28T13:51:16,382][WARN ][o.e.m.j.JvmGcMonitorService] [es-node121] [gc][689586] overhead, spent [1.7s] collecting in the last [2.4s]
[2023-04-28T14:01:22,595][INFO ][o.e.m.j.JvmGcMonitorService] [es-node121] [gc][young][690186][5804] duration [946ms], collections [1]/[1.3s], total [946ms]/[4.9m], memory [2.8gb]->[709.4mb]/[3.8gb], all_pools {[young] [2.1gb]->[0b]/[0b]}{[old] [682.5mb]->[683.2mb]/[3.8gb]}{[survivor] [29.5mb]->[26.1mb]/[0b]}
[2023-04-28T14:01:22,595][WARN ][o.e.m.j.JvmGcMonitorService] [es-node121] [gc][690186] overhead, spent [946ms] collecting in the last [1.3s]
[2023-04-28T14:07:29,297][INFO ][o.e.m.j.JvmGcMonitorService] [es-node121] [gc][690550] overhead, spent [579ms] collecting in the last [1.2s]
[2023-04-28T14:08:32,031][INFO ][o.e.m.j.JvmGcMonitorService] [es-node121] [gc][young][690612][5826] duration [815ms], collections [1]/[1.1s], total [815ms]/[4.9m], memory [2.9gb]->[705.4mb]/[3.8gb], all_pools {[young] [2.2gb]->[0b]/[0b]}{[old] [689.3mb]->[690.1mb]/[3.8gb]}{[survivor] [19.8mb]->[15.2mb]/[0b]}
[2023-04-28T14:08:32,032][WARN ][o.e.m.j.JvmGcMonitorService] [es-node121] [gc][690612] overhead, spent [815ms] collecting in the last [1.1s]
[2023-04-28T14:31:28,634][WARN ][o.e.m.j.JvmGcMonitorService] [es-node121] [gc][young][691975][5881] duration [1.1s], collections [1]/[1.4s], total [1.1s]/[5m], memory [2.9gb]->[742.7mb]/[3.8gb], all_pools {[young] [2.2gb]->[24mb]/[0b]}{[old] [704.9mb]->[704.9mb]/[3.8gb]}{[survivor] [19.3mb]->[17.8mb]/[0b]}
[2023-04-28T14:31:28,634][WARN ][o.e.m.j.JvmGcMonitorService] [es-node121] [gc][691975] overhead, spent [1.1s] collecting in the last [1.4s]
[2023-04-28T14:53:32,148][INFO ][o.e.m.j.JvmGcMonitorService] [es-node121] [gc][693287] overhead, spent [429ms] collecting in the last [1s]
[2023-04-28T14:59:45,546][INFO ][o.e.m.j.JvmGcMonitorService] [es-node121] [gc][young][693657][5949] duration [974ms], collections [1]/[1.1s], total [974ms]/[5m], memory [2.9gb]->[812.5mb]/[3.8gb], all_pools {[young] [2.2gb]->[72mb]/[0b]}{[old] [721.5mb]->[721.7mb]/[3.8gb]}{[survivor] [19.7mb]->[18.8mb]/[0b]}
[2023-04-28T14:59:45,547][WARN ][o.e.m.j.JvmGcMonitorService] [es-node121] [gc][693657] overhead, spent [974ms] collecting in the last [1.1s]
[2023-04-28T15:01:11,386][INFO ][o.e.m.j.JvmGcMonitorService] [es-node121] [gc][young][693742][5954] duration [859ms], collections [1]/[1.1s], total [859ms]/[5.1m], memory [2.9gb]->[744.5mb]/[3.8gb], all_pools {[young] [2.2gb]->[0b]/[0b]}{[old] [723.5mb]->[723.5mb]/[3.8gb]}{[survivor] [22.9mb]->[21mb]/[0b]}
[2023-04-28T15:01:11,386][WARN ][o.e.m.j.JvmGcMonitorService] [es-node121] [gc][693742] overhead, spent [859ms] collecting in the last [1.1s]
[2023-04-28T15:29:29,860][WARN ][o.e.m.j.JvmGcMonitorService] [es-node121] [gc][young][695422][6025] duration [1.3s], collections [1]/[1.4s], total [1.3s]/[5.1m], memory [2.9gb]->[766.4mb]/[3.8gb], all_pools {[young] [2.2gb]->[4mb]/[0b]}{[old] [742.4mb]->[742.4mb]/[3.8gb]}{[survivor] [16mb]->[20mb]/[0b]}
[2023-04-28T15:29:29,860][WARN ][o.e.m.j.JvmGcMonitorService] [es-node121] [gc][695422] overhead, spent [1.3s] collecting in the last [1.4s]
[2023-04-28T15:33:25,722][INFO ][o.e.m.j.JvmGcMonitorService] [es-node121] [gc][695656] overhead, spent [436ms] collecting in the last [1s]
[2023-04-28T16:14:16,296][INFO ][o.e.m.j.JvmGcMonitorService] [es-node121] [gc][698078] overhead, spent [428ms] collecting in the last [1s]
[2023-04-28T16:41:04,586][INFO ][o.e.m.j.JvmGcMonitorService] [es-node121] [gc][699667] overhead, spent [466ms] collecting in the last [1.4s]
[2023-04-28T16:42:15,088][INFO ][o.e.m.j.JvmGcMonitorService] [es-node121] [gc][699737] overhead, spent [297ms] collecting in the last [1s]
[2023-04-28T16:46:39,974][WARN ][o.e.m.j.JvmGcMonitorService] [es-node121] [gc][young][699999][6227] duration [1.3s], collections [1]/[2s], total [1.3s]/[5.3m], memory [2.5gb]->[667.1mb]/[3.8gb], all_pools {[young] [1.9gb]->[40mb]/[0b]}{[old] [607mb]->[608.9mb]/[3.8gb]}{[survivor] [23.2mb]->[18.1mb]/[0b]}
[2023-04-28T16:46:40,591][WARN ][o.e.m.j.JvmGcMonitorService] [es-node121] [gc][699999] overhead, spent [1.3s] collecting in the last [2s]
[2023-04-28T16:46:41,601][INFO ][o.e.m.j.JvmGcMonitorService] [es-node121] [gc][700000] overhead, spent [609ms] collecting in the last [1.6s]
[2023-04-28T16:50:33,083][INFO ][o.e.m.j.JvmGcMonitorService] [es-node121] [gc][700229] overhead, spent [669ms] collecting in the last [1.5s]
[2023-04-28T16:52:01,251][INFO ][o.e.m.j.JvmGcMonitorService] [es-node121] [gc][700316] overhead, spent [457ms] collecting in the last [1s]
[2023-04-28T17:02:01,065][WARN ][o.e.m.j.JvmGcMonitorService] [es-node121] [gc][young][700908][6279] duration [1.4s], collections [1]/[2.3s], total [1.4s]/[5.4m], memory [2.8gb]->[540.3mb]/[3.8gb], all_pools {[young] [2.2gb]->[0b]/[0b]}{[old] [514.9mb]->[515mb]/[3.8gb]}{[survivor] [27.4mb]->[25.2mb]/[0b]}
[2023-04-28T17:02:01,066][WARN ][o.e.m.j.JvmGcMonitorService] [es-node121] [gc][700908] overhead, spent [1.4s] collecting in the last [2.3s]
[2023-04-28T17:02:07,096][INFO ][o.e.m.j.JvmGcMonitorService] [es-node121] [gc][700914] overhead, spent [419ms] collecting in the last [1s]
[2023-04-28T17:23:21,497][INFO ][o.e.m.j.JvmGcMonitorService] [es-node121] [gc][702176] overhead, spent [414ms] collecting in the last [1.3s]
[2023-04-28T18:03:59,013][WARN ][o.e.m.j.JvmGcMonitorService] [es-node121] [gc][young][704583][6454] duration [2.6s], collections [1]/[2.8s], total [2.6s]/[5.5m], memory [2.8gb]->[760.7mb]/[3.8gb], all_pools {[young] [2.1gb]->[8mb]/[0b]}{[old] [594.6mb]->[594.7mb]/[3.8gb]}{[survivor] [112mb]->[158mb]/[0b]}
[2023-04-28T18:03:59,014][WARN ][o.e.m.j.JvmGcMonitorService] [es-node121] [gc][704583] overhead, spent [2.6s] collecting in the last [2.8s]
[2023-04-28T18:04:00,955][WARN ][o.e.m.j.JvmGcMonitorService] [es-node121] [gc][young][704584][6455] duration [1.7s], collections [1]/[1.9s], total [1.7s]/[5.6m], memory [760.7mb]->[761mb]/[3.8gb], all_pools {[young] [8mb]->[0b]/[0b]}{[old] [594.7mb]->[745mb]/[3.8gb]}{[survivor] [158mb]->[16mb]/[0b]}
[2023-04-28T18:04:00,955][WARN ][o.e.m.j.JvmGcMonitorService] [es-node121] [gc][704584] overhead, spent [1.7s] collecting in the last [1.9s]
[2023-04-28T18:05:45,314][INFO ][o.e.m.j.JvmGcMonitorService] [es-node121] [gc][704687] overhead, spent [286ms] collecting in the last [1s]
[2023-04-28T18:06:00,369][INFO ][o.e.m.j.JvmGcMonitorService] [es-node121] [gc][704702] overhead, spent [279ms] collecting in the last [1s]
[2023-04-28T18:11:35,368][INFO ][o.e.m.j.JvmGcMonitorService] [es-node121] [gc][705032] overhead, spent [444ms] collecting in the last [1s]
[2023-04-28T18:11:39,409][WARN ][o.e.m.j.JvmGcMonitorService] [es-node121] [gc][705036] overhead, spent [666ms] collecting in the last [1s]
[2023-04-28T18:20:22,344][INFO ][o.e.m.j.JvmGcMonitorService] [es-node121] [gc][705552] overhead, spent [535ms] collecting in the last [1.1s]
[2023-04-28T18:24:08,000][INFO ][o.e.m.j.JvmGcMonitorService] [es-node121] [gc][young][705775][6496] duration [894ms], collections [1]/[1.2s], total [894ms]/[5.6m], memory [2.4gb]->[1.1gb]/[3.8gb], all_pools {[young] [1.2gb]->[36mb]/[0b]}{[old] [1gb]->[1.1gb]/[3.8gb]}{[survivor] [158.6mb]->[31.9mb]/[0b]}
[2023-04-28T18:24:08,000][WARN ][o.e.m.j.JvmGcMonitorService] [es-node121] [gc][705775] overhead, spent [894ms] collecting in the last [1.2s]
[2023-04-28T18:24:09,343][WARN ][o.e.m.j.JvmGcMonitorService] [es-node121] [gc][young][705776][6497] duration [1s], collections [1]/[1.3s], total [1s]/[5.7m], memory [1.1gb]->[1gb]/[3.8gb], all_pools {[young] [36mb]->[0b]/[0b]}{[old] [1.1gb]->[1gb]/[3.8gb]}{[survivor] [31.9mb]->[10.1mb]/[0b]}
[2023-04-28T18:24:09,343][WARN ][o.e.m.j.JvmGcMonitorService] [es-node121] [gc][705776] overhead, spent [1s] collecting in the last [1.3s]
[2023-04-28T18:25:08,140][INFO ][o.e.m.j.JvmGcMonitorService] [es-node121] [gc][705834] overhead, spent [253ms] collecting in the last [1s]
[2023-04-28T18:46:27,927][INFO ][o.e.m.j.JvmGcMonitorService] [es-node121] [gc][707097] overhead, spent [334ms] collecting in the last [1s]
[2023-04-28T19:19:58,251][INFO ][o.e.m.j.JvmGcMonitorService] [es-node121] [gc][709079] overhead, spent [725ms] collecting in the last [1.7s]
[2023-04-28T20:59:14,222][WARN ][o.e.m.j.JvmGcMonitorService] [es-node121] [gc][young][714933][6592] duration [1.3s], collections [1]/[1.7s], total [1.3s]/[5.8m], memory [2.9gb]->[702.8mb]/[3.8gb], all_pools {[young] [2.2gb]->[0b]/[0b]}{[old] [657.2mb]->[657.2mb]/[3.8gb]}{[survivor] [26.5mb]->[45.6mb]/[0b]}
[2023-04-28T20:59:14,311][WARN ][o.e.m.j.JvmGcMonitorService] [es-node121] [gc][714933] overhead, spent [1.3s] collecting in the last [1.7s]

Compare this to Logs related to GC calls from last Saturday, it is as if GC was on holiday just as most of the users.

[2023-04-29T13:05:21,414][INFO ][o.e.m.j.JvmGcMonitorService] [es-node121] [gc][771904] overhead, spent [315ms] collecting in the last [1s]
[2023-04-29T13:10:43,603][INFO ][o.e.m.j.JvmGcMonitorService] [es-node121] [gc][772222] overhead, spent [325ms] collecting in the last [1s]
[2023-04-29T14:45:00,932][INFO ][o.e.m.j.JvmGcMonitorService] [es-node121] [gc][777796] overhead, spent [265ms] collecting in the last [1s]
[2023-04-29T14:54:08,984][INFO ][o.e.m.j.JvmGcMonitorService] [es-node121] [gc][778336] overhead, spent [392ms] collecting in the last [1.1s]
[2023-04-29T15:10:03,741][INFO ][o.e.m.j.JvmGcMonitorService] [es-node121] [gc][779279] overhead, spent [268ms] collecting in the last [1s]
[2023-04-29T19:52:35,114][INFO ][o.e.m.j.JvmGcMonitorService] [es-node121] [gc][795964] overhead, spent [331ms] collecting in the last [1s]
[2023-04-29T20:05:12,404][INFO ][o.e.m.j.JvmGcMonitorService] [es-node121] [gc][796708] overhead, spent [343ms] collecting in the last [1s]
[2023-04-29T20:13:23,304][INFO ][o.e.m.j.JvmGcMonitorService] [es-node121] [gc][797190] overhead, spent [371ms] collecting in the last [1s]
[2023-04-29T23:59:56,408][INFO ][o.e.m.j.JvmGcMonitorService] [es-node121] [gc][810553] overhead, spent [307ms] collecting in the last [1s]

GC up until a short while ago today. We are seeing breaks in indexing now.


Node Stats - nothing out of the ordinary -

[2023-05-01T05:40:14,635][WARN ][o.e.m.j.JvmGcMonitorService] [es-node121] [gc][915150] overhead, spent [681ms] collecting in the last [1s]
[2023-05-01T07:34:22,154][WARN ][o.e.m.j.JvmGcMonitorService] [es-node121] [gc][921872] overhead, spent [668ms] collecting in the last [1.1s]
[2023-05-01T08:08:34,294][INFO ][o.e.m.j.JvmGcMonitorService] [es-node121] [gc][923887] overhead, spent [388ms] collecting in the last [1.1s]
[2023-05-01T08:29:01,580][INFO ][o.e.m.j.JvmGcMonitorService] [es-node121] [gc][925092] overhead, spent [267ms] collecting in the last [1s]

Logs look like this once the system starts to slow down:

[2023-05-01T10:05:41,910][WARN ][o.e.m.f.FsHealthService  ] [es-node121] health check of [/var/lib/elasticsearch] took [6051ms] which is above the warn threshold of [5s]
[2023-05-01T10:06:34,670][INFO ][o.e.c.m.MetadataMappingService] [es-node121] [firewall-2023.05.01/ABaSuVsnRradB-ntfplznw] update_mapping [_doc]
[2023-05-01T10:08:20,345][ERROR][o.e.x.m.c.c.ClusterStatsCollector] [es-node121] collector [cluster_stats] timed out when collecting data: node [LHj9iH-CTBesKk199fQHdA] did not respond within [10s]
[2023-05-01T10:08:21,480][WARN ][o.e.t.TransportService   ] [es-node121] Received response for a request that has timed out, sent [11.1s/11190ms] ago, timed out [1s/1098ms] ago, action [cluster:monitor/stats[n]], node [{es-node120}{LHj9iH-CTBesKk199fQHdA}{Hm_ohKVwQzO8muJEgvzKDw}{es-node120}{192.168.1.120}{192.168.1.120:9300}{cdfhilmrstw}{8.7.0}{ml.allocated_processors_double=10.0, xpack.installed=true, ml.machine_memory=11477852160, ml.allocated_processors=10, ml.max_jvm_size=5742002176}], id [13890841]
[2023-05-01T10:12:42,974][WARN ][o.e.t.TransportService   ] [es-node121] Received response for a request that has timed out, sent [11.8s/11851ms] ago, timed out [1.7s/1761ms] ago, action [internal:coordination/fault_detection/follower_check], node [{es-node120}{LHj9iH-CTBesKk199fQHdA}{Hm_ohKVwQzO8muJEgvzKDw}{es-node120}{192.168.1.120}{192.168.1.120:9300}{cdfhilmrstw}{8.7.0}{ml.allocated_processors_double=10.0, xpack.installed=true, ml.machine_memory=11477852160, ml.allocated_processors=10, ml.max_jvm_size=5742002176}], id [13896172]
[2023-05-01T10:16:33,686][WARN ][o.e.c.InternalClusterInfoService] [es-node121] failed to retrieve shard stats from node [LHj9iH-CTBesKk199fQHdA]
org.elasticsearch.transport.ReceiveTimeoutTransportException: [es-node120][192.168.1.120:9300][indices:monitor/stats[n]] request_id [13901282] timed out after [14878ms]
[2023-05-01T10:16:39,847][WARN ][o.e.t.TransportService   ] [es-node121] Received response for a request that has timed out, sent [21.1s/21178ms] ago, timed out [6.3s/6300ms] ago, action [indices:monitor/stats[n]], node [{es-node120}{LHj9iH-CTBesKk199fQHdA}{Hm_ohKVwQzO8muJEgvzKDw}{es-node120}{192.168.1.120}{192.168.1.120:9300}{cdfhilmrstw}{8.7.0}{ml.allocated_processors_double=10.0, xpack.installed=true, ml.machine_memory=11477852160, ml.allocated_processors=10, ml.max_jvm_size=5742002176}], id [13901282]

What could this be attributed to?

If it's a lack of RAM, how can sizing for RAM be done based on the log load?

Could it be due to network connectivity issues between nodes? The VM hosts are connected to the same network switch and nothing seems out of place on the network. The hosts are connected and responding even when the stack becomes unresponsive or there are breaks in indexing.

It looks like you have monitoring installed. What does the graphs around JVM heap usage look like? The logs seem to indicate that you may be suffering from heap pressure or slow GC.

It might help if you could provide the full output of the cluster stats API.

Cluster Stats

{
  "_nodes": {
    "total": 3,
    "successful": 3,
    "failed": 0
  },
  "cluster_name": "es-firewall",
  "cluster_uuid": "eeyhaOO1Q3WTuBoSuwINwg",
  "timestamp": 1682936048823,
  "status": "green",
  "indices": {
    "count": 62,
    "shards": {
      "total": 125,
      "primaries": 62,
      "replication": 1.0161290322580645,
      "index": {
        "shards": {
          "min": 2,
          "max": 3,
          "avg": 2.0161290322580645
        },
        "primaries": {
          "min": 1,
          "max": 1,
          "avg": 1
        },
        "replication": {
          "min": 1,
          "max": 2,
          "avg": 1.0161290322580645
        }
      }
    },
    "docs": {
      "count": 201348584,
      "deleted": 1196669
    },
    "store": {
      "size_in_bytes": 177876197477,
      "total_data_set_size_in_bytes": 177876197477,
      "reserved_in_bytes": 0
    },
    "fielddata": {
      "memory_size_in_bytes": 75208,
      "evictions": 0
    },
    "query_cache": {
      "memory_size_in_bytes": 112764,
      "total_count": 28774,
      "hit_count": 5915,
      "miss_count": 22859,
      "cache_size": 195,
      "cache_count": 206,
      "evictions": 11
    },
    "completion": {
      "size_in_bytes": 0
    },
    "segments": {
      "count": 1355,
      "memory_in_bytes": 0,
      "terms_memory_in_bytes": 0,
      "stored_fields_memory_in_bytes": 0,
      "term_vectors_memory_in_bytes": 0,
      "norms_memory_in_bytes": 0,
      "points_memory_in_bytes": 0,
      "doc_values_memory_in_bytes": 0,
      "index_writer_memory_in_bytes": 117872096,
      "version_map_memory_in_bytes": 0,
      "fixed_bit_set_memory_in_bytes": 545744,
      "max_unsafe_auto_id_timestamp": 1682935605697,
      "file_sizes": {}
    },
    "mappings": {
      "total_field_count": 12564,
      "total_deduplicated_field_count": 7982,
      "total_deduplicated_mapping_size_in_bytes": 55786,
      "field_types": [
        {
          "name": "alias",
          "count": 153,
          "index_count": 3,
          "script_count": 0
        },
        {
          "name": "binary",
          "count": 3,
          "index_count": 3,
          "script_count": 0
        },
        {
          "name": "boolean",
          "count": 104,
          "index_count": 28,
          "script_count": 0
        },
        {
          "name": "byte",
          "count": 1,
          "index_count": 1,
          "script_count": 0
        },
        {
          "name": "constant_keyword",
          "count": 10,
          "index_count": 4,
          "script_count": 0
        },
        {
          "name": "date",
          "count": 276,
          "index_count": 49,
          "script_count": 0
        },
        {
          "name": "date_nanos",
          "count": 1,
          "index_count": 1,
          "script_count": 0
        },
        {
          "name": "date_range",
          "count": 3,
          "index_count": 3,
          "script_count": 0
        },
        {
          "name": "double",
          "count": 1,
          "index_count": 1,
          "script_count": 0
        },
        {
          "name": "double_range",
          "count": 1,
          "index_count": 1,
          "script_count": 0
        },
        {
          "name": "flattened",
          "count": 22,
          "index_count": 2,
          "script_count": 0
        },
        {
          "name": "float",
          "count": 111,
          "index_count": 14,
          "script_count": 0
        },
        {
          "name": "float_range",
          "count": 1,
          "index_count": 1,
          "script_count": 0
        },
        {
          "name": "geo_point",
          "count": 17,
          "index_count": 3,
          "script_count": 0
        },
        {
          "name": "geo_shape",
          "count": 1,
          "index_count": 1,
          "script_count": 0
        },
        {
          "name": "half_float",
          "count": 57,
          "index_count": 15,
          "script_count": 0
        },
        {
          "name": "integer",
          "count": 161,
          "index_count": 12,
          "script_count": 0
        },
        {
          "name": "integer_range",
          "count": 1,
          "index_count": 1,
          "script_count": 0
        },
        {
          "name": "ip",
          "count": 37,
          "index_count": 7,
          "script_count": 0
        },
        {
          "name": "ip_range",
          "count": 1,
          "index_count": 1,
          "script_count": 0
        },
        {
          "name": "keyword",
          "count": 5444,
          "index_count": 50,
          "script_count": 0
        },
        {
          "name": "long",
          "count": 1793,
          "index_count": 41,
          "script_count": 0
        },
        {
          "name": "long_range",
          "count": 1,
          "index_count": 1,
          "script_count": 0
        },
        {
          "name": "match_only_text",
          "count": 4,
          "index_count": 2,
          "script_count": 0
        },
        {
          "name": "nested",
          "count": 49,
          "index_count": 13,
          "script_count": 0
        },
        {
          "name": "object",
          "count": 1647,
          "index_count": 46,
          "script_count": 0
        },
        {
          "name": "scaled_float",
          "count": 2,
          "index_count": 2,
          "script_count": 0
        },
        {
          "name": "shape",
          "count": 1,
          "index_count": 1,
          "script_count": 0
        },
        {
          "name": "short",
          "count": 1,
          "index_count": 1,
          "script_count": 0
        },
        {
          "name": "text",
          "count": 2620,
          "index_count": 35,
          "script_count": 0
        },
        {
          "name": "version",
          "count": 6,
          "index_count": 6,
          "script_count": 0
        },
        {
          "name": "wildcard",
          "count": 34,
          "index_count": 2,
          "script_count": 0
        }
      ],
      "runtime_field_types": []
    },
    "analysis": {
      "char_filter_types": [],
      "tokenizer_types": [],
      "filter_types": [],
      "analyzer_types": [],
      "built_in_char_filters": [],
      "built_in_tokenizers": [],
      "built_in_filters": [],
      "built_in_analyzers": []
    },
    "versions": [
      {
        "version": "8.6.2",
        "index_count": 20,
        "primary_shard_count": 20,
        "total_primary_bytes": 214829502
      },
      {
        "version": "8.7.0",
        "index_count": 42,
        "primary_shard_count": 42,
        "total_primary_bytes": 88480486157
      }
    ],
    "search": {
      "total": 1821,
      "queries": {
        "match_phrase": 2,
        "bool": 1779,
        "terms": 698,
        "prefix": 5,
        "match": 293,
        "match_phrase_prefix": 1,
        "match_all": 1,
        "exists": 521,
        "range": 1110,
        "term": 1630,
        "nested": 12,
        "simple_query_string": 32
      },
      "sections": {
        "runtime_mappings": 1,
        "query": 1783,
        "terminate_after": 6,
        "_source": 69,
        "pit": 6,
        "fields": 1,
        "collapse": 309,
        "aggs": 623
      }
    }
  },
  "nodes": {
    "count": {
      "total": 3,
      "coordinating_only": 0,
      "data": 3,
      "data_cold": 3,
      "data_content": 3,
      "data_frozen": 3,
      "data_hot": 3,
      "data_warm": 3,
      "index": 0,
      "ingest": 3,
      "master": 3,
      "ml": 3,
      "remote_cluster_client": 3,
      "search": 0,
      "transform": 3,
      "voting_only": 0
    },
    "versions": [
      "8.7.0"
    ],
    "os": {
      "available_processors": 26,
      "allocated_processors": 26,
      "names": [
        {
          "name": "Linux",
          "count": 3
        }
      ],
      "pretty_names": [
        {
          "pretty_name": "Ubuntu 22.04.2 LTS",
          "count": 3
        }
      ],
      "architectures": [
        {
          "arch": "amd64",
          "count": 3
        }
      ],
      "mem": {
        "total_in_bytes": 28147302400,
        "adjusted_total_in_bytes": 28147302400,
        "free_in_bytes": 3412008960,
        "used_in_bytes": 24735293440,
        "free_percent": 12,
        "used_percent": 88
      }
    },
    "process": {
      "cpu": {
        "percent": 37
      },
      "open_file_descriptors": {
        "min": 702,
        "max": 762,
        "avg": 738
      }
    },
    "jvm": {
      "max_uptime_in_millis": 5091275,
      "versions": [
        {
          "version": "19.0.2",
          "vm_name": "OpenJDK 64-Bit Server VM",
          "vm_version": "19.0.2+7-44",
          "vm_vendor": "Oracle Corporation",
          "bundled_jdk": true,
          "using_bundled_jdk": true,
          "count": 3
        }
      ],
      "mem": {
        "heap_used_in_bytes": 3682976384,
        "heap_max_in_bytes": 14080278528
      },
      "threads": 298
    },
    "fs": {
      "total_in_bytes": 630724681728,
      "free_in_bytes": 421015044096,
      "available_in_bytes": 388752457728
    },
    "plugins": [],
    "network_types": {
      "transport_types": {
        "security4": 3
      },
      "http_types": {
        "security4": 3
      }
    },
    "discovery_types": {
      "multi-node": 3
    },
    "packaging_types": [
      {
        "flavor": "default",
        "type": "deb",
        "count": 3
      }
    ],
    "ingest": {
      "number_of_pipelines": 33,
      "processor_stats": {
        "csv": {
          "count": 0,
          "failed": 0,
          "current": 0,
          "time_in_millis": 0
        },
        "date": {
          "count": 0,
          "failed": 0,
          "current": 0,
          "time_in_millis": 0
        },
        "geoip": {
          "count": 0,
          "failed": 0,
          "current": 0,
          "time_in_millis": 0
        },
        "grok": {
          "count": 0,
          "failed": 0,
          "current": 0,
          "time_in_millis": 0
        },
        "pipeline": {
          "count": 0,
          "failed": 0,
          "current": 0,
          "time_in_millis": 0
        },
        "remove": {
          "count": 0,
          "failed": 0,
          "current": 0,
          "time_in_millis": 0
        },
        "rename": {
          "count": 0,
          "failed": 0,
          "current": 0,
          "time_in_millis": 0
        },
        "script": {
          "count": 0,
          "failed": 0,
          "current": 0,
          "time_in_millis": 0
        },
        "set": {
          "count": 0,
          "failed": 0,
          "current": 0,
          "time_in_millis": 0
        },
        "set_security_user": {
          "count": 0,
          "failed": 0,
          "current": 0,
          "time_in_millis": 0
        }
      }
    },
    "indexing_pressure": {
      "memory": {
        "current": {
          "combined_coordinating_and_primary_in_bytes": 0,
          "coordinating_in_bytes": 0,
          "primary_in_bytes": 0,
          "replica_in_bytes": 0,
          "all_in_bytes": 0
        },
        "total": {
          "combined_coordinating_and_primary_in_bytes": 0,
          "coordinating_in_bytes": 0,
          "primary_in_bytes": 0,
          "replica_in_bytes": 0,
          "all_in_bytes": 0,
          "coordinating_rejections": 0,
          "primary_rejections": 0,
          "replica_rejections": 0
        },
        "limit_in_bytes": 0
      }
    }
  }
}

We don't have JVM usage graphs in Stack Monitoring at the moment. I am trying to figure out how to get them there, any tips on this would sure be a great help!

That is something I would prioritise as this is one of the most important things to monitor in order to maintain a healthy cluster.

JVM Heap usage graph.

We turned the stack off for some time between 1330-1400 hours today, that is why there is a break in the graph during that period. Log input is turned off at the moment as the Kibana interface is extremely slow to respond otherwise.

Edit: added more JVM usage graphs.

It looks like you may need to increase heap and RAM for the nodes. The size of the heap should be mo more than 50% of available RAM.

Is there a way to calculate the size of RAM that would be required based on the Cluster stats or any other parameters?

Looks like heap size is automatically set at 50% of available RAM by default. The VM runs just Elasticsearch, would it be advisable to try increasing the heap size to something like say 65-70% of available RAM?

I do not see anything in the stats that stand out, so it may be due to the mappings used.

No, it should not be set to more than 50% of RAM. The memory not use by the heap is very important for Elasticsearch performance. I would recommend increasing the memory of the VMs somewhat and see what impact it has. Ensure you do not go too far so memory is swapped out to disk.

JVM Heap usage graphs seem to indicate a gap of some 1 to 1.5GB between the max heap and used heap at all times. What is the threshold for GC coming into play?

As for the mappings, could it be that some fields are being improperly mapped, perhaps there could be errors. The logs (/var/log/Elasticsearch/ES-firewall.log) don’t indicate this. Perhaps there are other ways to identify this?

Thank you for sticking with the thread :slight_smile:

Update

So we added a cache (reis) between FileBeat & Logstash in an attempt to stem log loss due to excessive load on the Elasticsearch Cluster.

The results have been positive so far, with the exception that every time ES updates the index's mapping, we see the cache filling up.

[2023-05-09T09:29:01,523][INFO ][o.e.c.m.MetadataMappingService] [es-node121] [firewall-2023.05.09/QuXSSyGcROmion_QbLF8Lg] update_mapping [_doc]
[2023-05-09T09:29:35,051][INFO ][o.e.c.m.MetadataMappingService] [es-node121] [firewall-2023.05.09/QuXSSyGcROmion_QbLF8Lg] update_mapping [_doc]
[2023-05-09T09:30:05,857][INFO ][o.e.c.m.MetadataMappingService] [es-node121] [firewall-2023.05.09/QuXSSyGcROmion_QbLF8Lg] update_mapping [_doc]

It takes several hours for the cache to empty out and there is a time lag in the availability of logs during this period as ES works to clear index the contents of queue/cache.

The JVM Heap usage and other stats now look like this:

So, we have gone from loosing logs to getting logs after a delay.

What more can be done to improve the performance of the stack?

Would having one of the 3 Elasticsearch nodes as a fixed Master node and designating the remaining 2 nodes as Data nodes be beneficial?