Identifying the cause of an unresponsive ES Cluster

You should always look to have 3 master eligible nodes in the cluster, so that is a bad idea.

This is interesting. When mappings are updated the cluster state gets updated and propagated to the other nodes. If this is slow and causes problems your cluster may either be overloaded or have slow storage. From the latest set of graphs JVM heap usage and CPU usage both seem fine.

This makes me suspect your storage. You mentioned that you have SSD storage. Is this a pure SSD drive or some kind of hybrid disk with an SSD based cache backed by a large HDD?

The storage is ADATA SX6000PNP, it is a pure SSD Drive.

The VM disk layout is:

# fdisk -l
Disk /dev/loop0: 63.32 MiB, 66392064 bytes, 129672 sectors
Units: sectors of 1 * 512 = 512 bytes
Sector size (logical/physical): 512 bytes / 512 bytes
I/O size (minimum/optimal): 512 bytes / 512 bytes


Disk /dev/loop1: 111.95 MiB, 117387264 bytes, 229272 sectors
Units: sectors of 1 * 512 = 512 bytes
Sector size (logical/physical): 512 bytes / 512 bytes
I/O size (minimum/optimal): 512 bytes / 512 bytes


Disk /dev/loop2: 63.34 MiB, 66412544 bytes, 129712 sectors
Units: sectors of 1 * 512 = 512 bytes
Sector size (logical/physical): 512 bytes / 512 bytes
I/O size (minimum/optimal): 512 bytes / 512 bytes


Disk /dev/loop3: 79.95 MiB, 83832832 bytes, 163736 sectors
Units: sectors of 1 * 512 = 512 bytes
Sector size (logical/physical): 512 bytes / 512 bytes
I/O size (minimum/optimal): 512 bytes / 512 bytes


Disk /dev/loop4: 53.24 MiB, 55824384 bytes, 109032 sectors
Units: sectors of 1 * 512 = 512 bytes
Sector size (logical/physical): 512 bytes / 512 bytes
I/O size (minimum/optimal): 512 bytes / 512 bytes


Disk /dev/loop5: 53.24 MiB, 55824384 bytes, 109032 sectors
Units: sectors of 1 * 512 = 512 bytes
Sector size (logical/physical): 512 bytes / 512 bytes
I/O size (minimum/optimal): 512 bytes / 512 bytes


Disk /dev/sda: 300 GiB, 322122547200 bytes, 629145600 sectors
Disk model: VBOX HARDDISK
Units: sectors of 1 * 512 = 512 bytes
Sector size (logical/physical): 512 bytes / 512 bytes
I/O size (minimum/optimal): 512 bytes / 512 bytes
Disklabel type: gpt
Disk identifier: 48192D23-F225-4EC2-A987-FCAC8CB6E61E

Device       Start       End   Sectors  Size Type
/dev/sda1     2048      4095      2048    1M BIOS boot
/dev/sda2     4096   4198399   4194304    2G Linux filesystem
/dev/sda3  4198400 629143551 624945152  298G Linux filesystem


Disk /dev/mapper/ubuntu--vg-ubuntu--lv: 200 GiB, 214748364800 bytes, 419430400 sectors
Units: sectors of 1 * 512 = 512 bytes
Sector size (logical/physical): 512 bytes / 512 bytes
I/O size (minimum/optimal): 512 bytes / 512 bytes

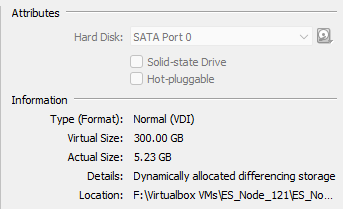
The Virtual Disk config is:
VM_HDD

Could the issue be due to something missing in the VM settings (Edit: apart from the missing check mark on the Solid-state Drive option)?

Something seems off about your cluster, but I am not sure what. I will have to leave it at this point and see if anyone else have any further suggestions.

TL;DR - Removing Logstash CIDR Filter plugin solved the issue.

We've solved the issue (for now at least :slight_smile: ).

Here is a brief summary of the issue just in case someone runs into something similar.

The initial setup (all VMs spread across multiple machines):
Filebeat -- Logstash -- ES (3 node cluster)

Logstash filters are in use for log enrichment based on source ip and other details.

Trouble was, the Kibana interface would become unresponsive and there were visible gaps in logs being ingested.

Assuming this was due to the ES stack could not keep up with the log volume, we added Redis to the mix. The revised setup:

Filebeat -- Redis -- Logstash -- ES (3 node cluster)

After Redis was added, logs were consistent. However, over time Redis's queue would get filled up to the point where all its RAM would be used up.

Clearly, this needed more than Redis to work! So we decided to move the ES cluster from VMs to physical machines. We moved 2 nodes off VMs, one remained a VM. (There was a lesson about adding new nodes to the cluster while retaining at least 2 existing nodes we learned here).

Things worked fine for a while, but then Redis's queue started getting filled up again. At this point we decided to look at other components in the stack. We decided to remove filters from Logstash one by one to see if it had any impact. Turns out, the bottleneck was the CIDR filter plugin.

We were adding some fields based on source IP using the CIDR filter plugin. The CIDR filter plugin was used for looking up the subnet to which the source IP belonged based on which logs were enriched.

The maximum output of logstash with the CIDR filter enabled hovered around ~800/s. When the log input exceeded this figure there would be log loss or Redis queue would start getting filled up (after Redis was deployed).

Things are normal now without the CIDR filter plugin being used. We are working on finding an alternate to it.

Thanks everyone!
1 Like

This topic was automatically closed 28 days after the last reply. New replies are no longer allowed.