Hi guys,
I need some help on this one:
I exported a csv file from Grafana, only fields are "time" and "cpu", delimited by a comma, example lines:
2024-03-13 12:15:00,38%
2024-03-13 12:30:00,34%
2024-03-13 12:45:00,35%
2024-03-13 13:00:00,37%
So I basically want the same visual in Kibana as in Grafana, but can't get it to work.
Grafana looks like this:
Kibana:
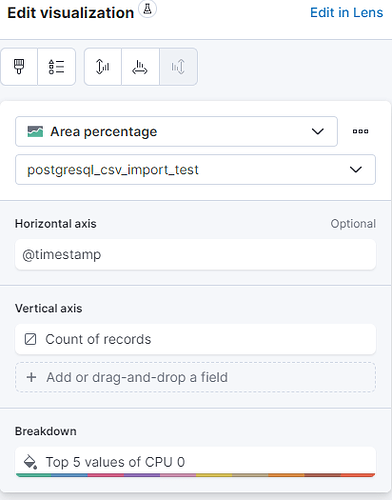
I made this visual with Lens and this is the setting:
I tried different ways but can't figure out the right way.
Kibana is on version 8.12.2, Grafana 10.4.0
Any help is greatly appreciated!
Thanks in advance


