Hi, I'm very new to ELK, and I have a very rookie question. I want to monitor the applications running in our kubernetes solution and we chose ELK for it. I have followed the instructions on Deploy ECK in your Kubernetes cluster | Elastic Cloud on Kubernetes [2.2] | Elastic but I don't know what I'm supposed to do next? It only says how to install and access the UI in kibana, but I can't find a way to start adding logs and other information to Elasticsearch. Perhaps I'm not reading the documentation in the right order but I can't figure out how to use the stack... Any help is much appreciate it!
Hi @levitoh123 Welcome to the community and thanks for installing the Elastic Stack using ECK
You can use the new Elastic Agent and Fleet or Beats to get started ... lots of ways to get data in, there is even some sample data sets to play with.
Top of the Docs there are few ways to get started...
There are also a number of getting started videos
Thanks @stephenb I've been looking at the docs but the order is yet not clear for me. I have used the sample data, it looks good. Now, to start using my own data, I don't know what would be the next step. I installed APM Server as specified here - * Run APM Server on ECK and then I checked on the logs of the running pod, but it it giving an error message:
{"log.level":"error","@timestamp":"2022-06-13T03:10:13.216Z","log.logger":"beater","log.origin":{"file.name":"beater/waitready.go","file.line":62},"message":"precondition 'apm integration installed' failed: error querying Elasticsearch for integration index templates: unexpected HTTP status: 404 Not Found ({\"error\":{\"root_cause\":[{\"type\":\"resource_not_found_exception\",\"reason\":\"index template matching [logs-apm.error] not found\"}],\"type\":\"resource_not_found_exception\",\"reason\":\"index template matching [logs-apm.error] not found\"},\"status\":404}): to remediate, please install the apm integration: https://ela.st/apm-integration-quickstart","service.name":"apm-server","ecs.version":"1.6.0"}
I go and check on Kibana for this and I get No APM Server detected. Please make sure it is running and you have updated to 7.0 or higher. - see in screenshot below.

Is the order of the documentation not in the right order to setup the whole stack? or am I missing something after deploying the APM server?
Thank you again!
Did you use all the defaults or did you customize the configuration.
If you are speaking of this order.. it is not absolute but yes that looks right...
I think there is an elasticsearch, kibana apm sample here

I used most all the default configurations, but I added nodeSelectors. My manifests are these ones:
# elasticsearch.yaml
apiVersion: elasticsearch.k8s.elastic.co/v1
kind: Elasticsearch
metadata:
  name: elasticsearch-develop
  namespace: develop
spec:
  version: 8.2.2
  nodeSets:
  - name: master
    count: 1
    config:
      node.roles: ["master"]
      node.store.allow_mmap: false
    podTemplate:
        spec:
          nodeSelector:
            agentpool: agentpool2
  - name: data
    count: 1
    config:
      node.roles: ["data", "ingest", "ml", "transform"]
      node.store.allow_mmap: false
    podTemplate:
        spec:
          nodeSelector:
            agentpool: agentpool2
---
#kibana.yaml
apiVersion: kibana.k8s.elastic.co/v1
kind: Kibana
metadata:
  name: kibana-develop
  namespace: develop
spec:
  version: 8.2.2
  count: 1
  elasticsearchRef:
    name: "elasticsearch-develop"
  podTemplate:
    spec:
      containers:
        - name: kibana
          resources:
            requests:
              memory: 1Gi
              cpu: 0.5
            limits:
              memory: 2Gi
              cpu: 2
      nodeSelector:
        agentpool: agentpool2
---
# apm.yaml
apiVersion: apm.k8s.elastic.co/v1
kind: ApmServer
metadata:
  name: apm-server-develop
  namespace: develop
spec:
  version: 8.2.2
  count: 1
  elasticsearchRef:
    name: "elasticsearch-develop"
  kibanaRef:
    name: "kibana-develop"
  podTemplate:
    spec:
      nodeSelector:
        agentpool: agentpool2
I haven't gone further than Run APM Server on ECK because I am seeing the error that I mentioned in the previous message.
Ok Well good news I did a simple install of the quickstart and ended up in the same situation /same error!
tl;dr 8.x Changes how APM Server runs, it is part of Fleet, so setup the integration.
I forgot to take a screen shot though
Set It Up
On the next Page Accept All the Defaults
It will Spin for a minute or 2 and, you can setup agents later.
Then you should get back to this!
(And Yes that should probably be in the docs!) ![]()
Give it a try!

Ohh Don't Forget to scroll to the bottom and load the additional Kibana Assets

Amazing, I got the green message! thank you for that... so it is not actually necesary to deploy the APM manifest if I setup the APM integration by the UI.
Now, as next step I supposed I will need to setup the agents? but as to my understanding, isn't that supposed to be the idea of Fleet? to automatically deploy the agents in all hosts in the cluster? or I have to do this manually for each pod running in the cluster? and If so, do I need to add that as a container in the pod's or deployment manifest?
Hmm.... Is that a question or a statement???
I deployed the apm server via the manifest and then did the integration.
Are you saying you did it without installing via the manifest?
Fleet does not install the agents. It manages the agents and installs integrations.
Think of the agent as the piece of control software at the endpoint and fleet manages what integrations are installed into that agent.
Course it depends on what you want to collect and monitor.
If you want Fleet managed agents
Keep plugging away. You'll do fine.
Well I didn't run the APM server manifest, I don't know how this is needed if APM integration in Kibana says that the server is ok.

I run the quickstart from Run Fleet-managed Elastic Agent on ECK | Elastic Cloud on Kubernetes [2.2] | Elastic and I got a bunch of agents spinned up in the cluster, but in Kibana I'm not able to see anything.
The logs in each agent's pod is giving this error:
{"log.level":"warn","@timestamp":"2022-06-14T04:36:21.001Z","log.origin":{"file.name":"cmd/enroll_cmd.go","file.line":472},"message":"Remote server is not ready to accept connections, will retry in a moment.","ecs.version":"1.6.0"}
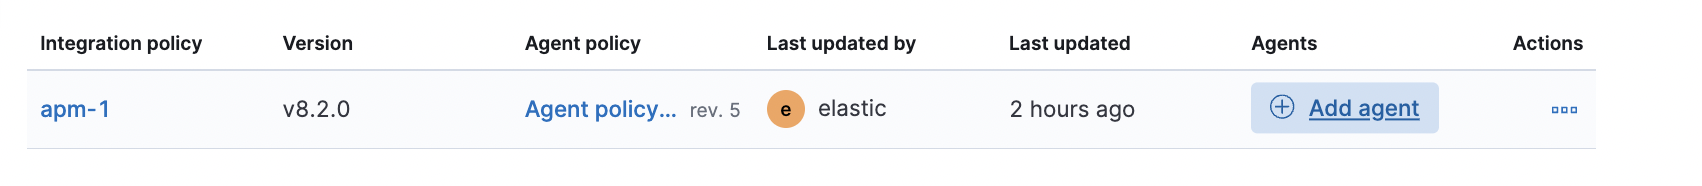
And when I click on "add agent" in the "Manage APM integration in Fleet", the Waiting for Fleet Server to connect... message keeps looping with nothing showing up even when I have all the Agent pods running.


The APM integration with Fleet and kubernetes is probably the most technical and new one there is.
Fleet and agent with kubernetes is just in technical preview so it's new and probably not as easy as we'd all like it to be.
My question, have you ever used an APM service before like new relic or app dynamics or Elastic APM.
You need to have an application that you're monitoring. Then you need to apply the APM agent and only some languages and frameworks are supported by the elastic fleet-based agent. (I have not even tried them out yet)
Right now you do You have have any applications to monitor besides the ELK stack? If not.. I'm not sure what you're actually looking for.
If I was just getting started , I think the first thing I would try with the Agent and Fleet is just to do simple things like metrics and container logs. That's where I'd start with.
I'm not say not experiment but I'm not sure I'll be able to walk you through every bit of this.
If you want to learn more about APM. I would read about the observability and agents etc. In the observability section of our documents.
Yes I understand and to clarify I haven't used an APM service before.
I have a a set of apps running in kubernetes right now, they are producing logs via standard python logger. I want to be able to send these logs to Elasticsearch and monitor the application in Kibana. So I do understand that I have to setup ECK and after install the APM library via pip in the application and send the logs to the server, but for that to happen (and before start modifying the code with the wrappers) I need to make sure that I have the stack running - and this is where I'm stuck.
I get your suggestion, I think it is a good start to get metrics and container logs, and that's exactly what I'm pursuing but I haven't been able to do it due to all these errors in the configuration.
The documentation provides a simple way to setup the stack but not how to use it, IMO. I'll keep on reading and try out things... Thank you for your help.
If you look at filebeat and metricbeat and follow the quick start for deployment on K8s; metrics and logs should show up :slight_smile.
The Elastic Agent integrations w K8s is pretty new the metricbeat and filebeat have been around for a whi look at
Or Perhaps try these