Hello everyone,
I'm working on an application to analyze my spending. The idea is to store all bank account transactions in Elasticsearch and analyze them using Kibana. For now I have a local development environment based on Docker Compose (using DDEV as tool on top of Docker and Docker Compose).
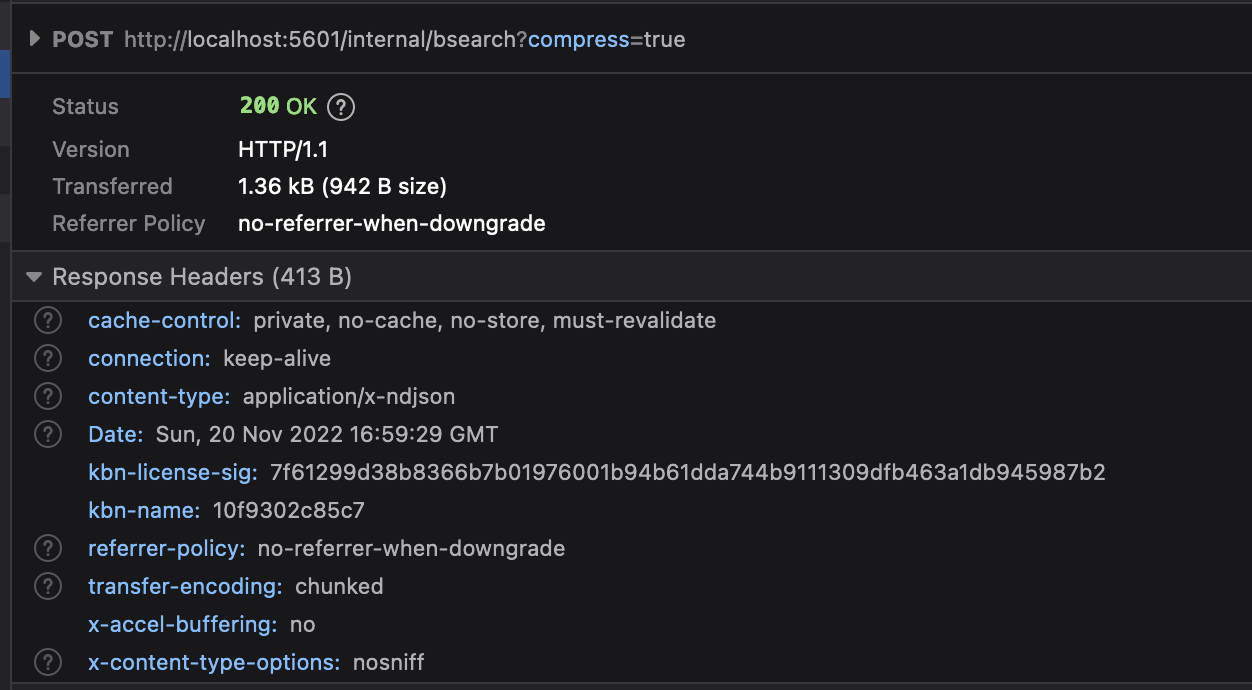
I successfully created an index, created the documents and can request them in the Kibana console. Now when I want to use the Discover tool of Kibana, I see the request takes around 2 minutes and finally showing an error:
Search Error: JSON.parse: unexpected character at line 1 column 1 of the JSON data
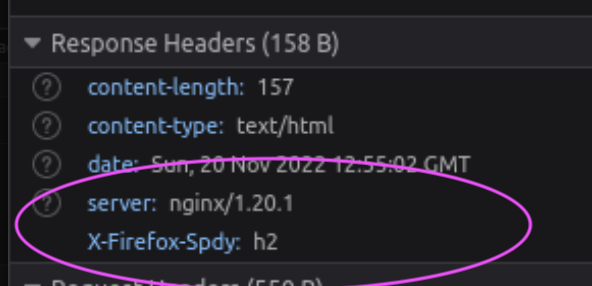
A search brought me to a related issue on GitHub which showed that this error has a variety of reasons but non of the discussed seems to apply to my use case (or I can't see the similarities there). The underlying problem seems that the request to /internal/bfetch returns a 405 - not allowed error (after 2 minutes of waiting):

Now I struggle to find relevant logs of the Kibana container. The one I get by ddev logs -s kibana just looks like a common access log and does not contain any 405 related error. How would I look for error logs in a plain Docker Compose setup (ignoring DDEV)? I also increased the memory limit for Kibana as suggested in the GitHub issue thread but that seems to have no effect.
Some more information about the setup:
A document from the transaction index looks like this
GET transactions/_doc/62cac2e8-ec3d-4095-a7a6-7ee749cfe796

{
  "_index" : "transactions",
  "_type" : "_doc",
  "_id" : "62cac2e8-ec3d-4095-a7a6-7ee749cfe796",
  "_version" : 1,
  "_seq_no" : 606,
  "_primary_term" : 1,
  "found" : true,
  "_source" : {
    "account" : {
      "label" : "Giro ****",
      "iban" : "********"
    },
    "booking_day" : "14.09.2022",
    "valuta_day" : "14.09.2022",
    "amount" : "-11.37",
    "amount_currency" : "EUR",
    "balance" : "713.80",
    "balance_currency" : "EUR",
    "cagegories" : [
      "groceries"
    ],
    "origin" : "VISA *****",
    "type" : "Lastschrift",
    "reference" : "NR ***** Google Pay"
  }
}
The Docker Compose services for Elasticsearch is:
version: '3.6'
services:
  elasticsearch:
    container_name: ddev-${DDEV_SITENAME}-elasticsearch
    hostname: ${DDEV_SITENAME}-elasticsearch
    image: elasticsearch:7.17.6
    expose:
      - "9200"
      - "9300"
    environment:
      - cluster.name=docker-cluster
      - discovery.type=single-node
      - bootstrap.memory_lock=true
      - "ES_JAVA_OPTS=-Xms512m -Xmx512m"
      - VIRTUAL_HOST=$DDEV_HOSTNAME
      - HTTP_EXPOSE=9200:9200
      - HTTPS_EXPOSE=9201:9200
      - xpack.security.enabled=false
    labels:
      com.ddev.site-name: ${DDEV_SITENAME}
      com.ddev.approot: $DDEV_APPROOT
    volumes:
      - elasticsearch:/usr/share/elasticsearch/data
      - ".:/mnt/ddev_config"
    healthcheck:
      test: ["CMD-SHELL", "curl --fail -s localhost:9200"]

volumes:
  elasticsearch:
and for Kibana:
version: '3.6'
services:
    kibana:
        container_name: ddev-${DDEV_PROJECT}-kibana
        hostname: ${DDEV_PROJECT}-kibana
        image: docker.elastic.co/kibana/kibana:7.17.7
        restart: "no"
        expose:
            - '5601'
        labels:
            com.ddev.site-name: ${DDEV_SITENAME}
            com.ddev.approot: $DDEV_APPROOT
        environment:
            - VIRTUAL_HOST=$DDEV_HOSTNAME
            - HTTP_EXPOSE=5601:5601
            - HTTPS_EXPOSE=5602:5601
            - ELASTICSEARCH_HOSTS=http://ddev-${DDEV_PROJECT}-elasticsearch:9200
            - SERVER_NAME=ddev-${DDEV_PROJECT}-elasticsearch
            - NODE_OPTIONS=--max-old-space-size=4096
        volumes:
            - '.:/mnt/ddev_config'
        depends_on:
            - elasticsearch
Any hint about where I should continue to debug would be much appreciated.