Hi Team,
I have several log event with GMT time period. Initially we are converting the event time while inserting in elasticsearch because the log file is creating in PST server but event time is in GMT. we are using the kibana in PST region and kibana showing the data till 5 PM PST in discover and this scenario is happening only when i try to apply the below timezone in logstash. Please find the below image.
Reason for conversion,
Since the server is in PST time region elasticsearch trying to convert the PST to GMT, but in my case the log events are in GMT time. To avoid conflict or mismatch of event we preferred the below conversion process.
date {
match => ["iis_eventDate", "YYYY-MM-dd HH:mm:ss" ]
target => ["iis_eventDate"]
timezone => ['Etc/GMT']
}
I don't think this is an elasticsearch but a logstash configuration issue. The problem here seems to be setting up the "target" field in the date filter. When you set it up in this fashion, your @timestamp attribute will be the time when the log is being processed by logstash. Is this what you intend? Or do you want the @timestamp to be the time the log was generated?
To clarify further, could you add your current log entry, current logstash output document and expected logstash output document?
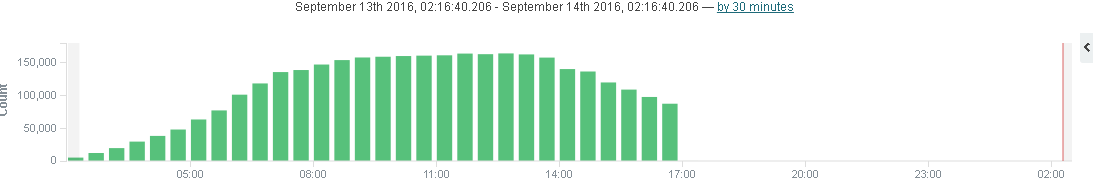
In the above image highlighted line is used to index the events in kibana.
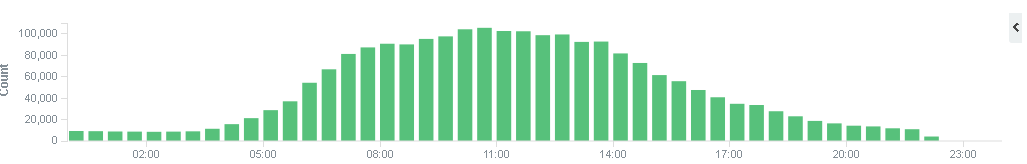
Below image contain red line it shows the value processed from log.
This is my processed events
2016-10-12 00:00:00 12.23 GET xx - 80 - 10.53.81.26 Mozilla/4.0+(compatible;+MSIE+8.0;+Windows+NT+5.1;+Trident/4.0) 302 0 0 22
2016-10-12 00:00:00 12.23 GET XX - 80 - 10.53.81.25 Mozilla/5.0+(Windows+NT+6.1;+WOW64;+Trident/7.0;+rv:11.0)+like+Gecko 200 0 0 791
Please help me to resplve this issue. Clueless why its making delay to show up the record. expecting your reply asap
@Ganesh2303 I don't think there is any issue here. I believe kibana is showing you all the data, however it is localizing the date based on where you are located. Notice the following setting in Kibana in Settings-> Advanced
This setting sources the location from browser and will convert time fields accordingly so you see converted time for youre location. Please try tweaking this setting observing the data you see.
Yes your right only actually it is in that format. My issues is not with that, actually kibana is fail to display the value after the time 4.30 PM but at background data is processing. its start showing the data on next day after 8.00 AM that time its contain all the data of previous data and current data again it stops at same 4.30 PM.
Apache, Apache Lucene, Apache Hadoop, Hadoop, HDFS and the yellow elephant
logo are trademarks of the
Apache Software Foundation
in the United States and/or other countries.