Jupyter -> Vega -> Kibana visualization (without disabling security). How?

So we want to leverage the data-science and visualization strengths of Python on our ELK data and then use the Elastic API to send the resulting visualization to update a dashboard. Specifically, this refers to setting the index name to .kibana, which now results in the error:

    AuthorizationException: AuthorizationException(403, 'security_exception', 'action [indices:data/write/bulk[s]] is unauthorized for user [elastic] with roles [superuser] on indices [.kibana_8.1.2_001,.kibana], this action is granted by the index privileges [create_doc,create,delete,index,write,all]')

We think this must be possible through normal API usage without disabling any security settings. We did try adding a user with every possible permission added, and it could not perform this action during our testing.

There are plenty of resources discussing this, only one of which actually provided a working example, however they leveraged now deprecated security bypasses, more of a hacWe think this must be possible through normal API usage without disabling any security settings.

Here's the example referred to as well as the overarching project which inspired us to try this.

Note that Vega is now a default feature of Kibana rather than a plugin, so this workflow should be even more viable now.

So our code goes like this:

    import eland as ed
    import datetime
    import altair as alt
    import eland as ed
    import json
    import numpy as np
    import matplotlib.pyplot as plt
    import vega_datasets
    from elasticsearch import Elasticsearch
    
    cloud_id = "secret"
    http_auth = ("username", "password")
    es = Elasticsearch(cloud_id=cloud_id, http_auth=http_auth)
    
    data = vega_datasets.data
    pd_df = data.cars()
    chart = alt.Chart(pd_df).mark_point().encode(
        x='Miles_per_Gallon',
        y='Horsepower'
    ).interactive()
    
    def saveVegaVis(client, index, visName, altairChart, resultSize=100, timeField=True):
        chart_json = json.loads(altairChart.to_json())
        visState = {
          "type": "vega",
          "aggs": [],
          "params": {
            "spec": json.dumps(chart_json, sort_keys=True, indent=4, separators=(',', ': ')),
          },
          "title": visName
        }
        visSavedObject={
            "visualization" : {
              "title" : visName,
              "visState" : json.dumps(visState, sort_keys=True, indent=4, separators=(',', ': ')),
              "uiStateJSON" : "{}",
              "description" : "",
              "version" : 1,
              "kibanaSavedObjectMeta" : {
                "searchSourceJSON" : json.dumps({
                  "query": {
                    "language": "kuery",
                    "query": ""
                  },
                  "filter": []
                }),
              }
            },
            "type" : "visualization",
            "references" : [ ],
            "migrationVersion" : {
              "visualization" : "8.0.0"
            },
            "updated_at" : datetime.datetime.now().strftime("%Y-%m-%dT%H:%M:%S.000Z")
        }
    
    
        return client.index(index=index,id='visualization:'+visName,body=visSavedObject)
    
    saveVegaVis(es, 'test_visuals', 'def-vega-cars-1', chart, resultSize=1000)

After executing this code, we get a success message:

    ObjectApiResponse({'_index': 'test_visuals', '_id': 'visualization:def-vega-cars-1', '_version': 8, 'result': 'updated', '_shards': {'total': 2, 'successful': 1, 'failed': 0}, '_seq_no': 7, '_primary_term': 1})

But within ELK, the resulting object is not treated like a visualization, it's treated like a normal index entry.

We want it to show up like:
enter image description here

But rather, we can only see it as a normal index entry, like so:

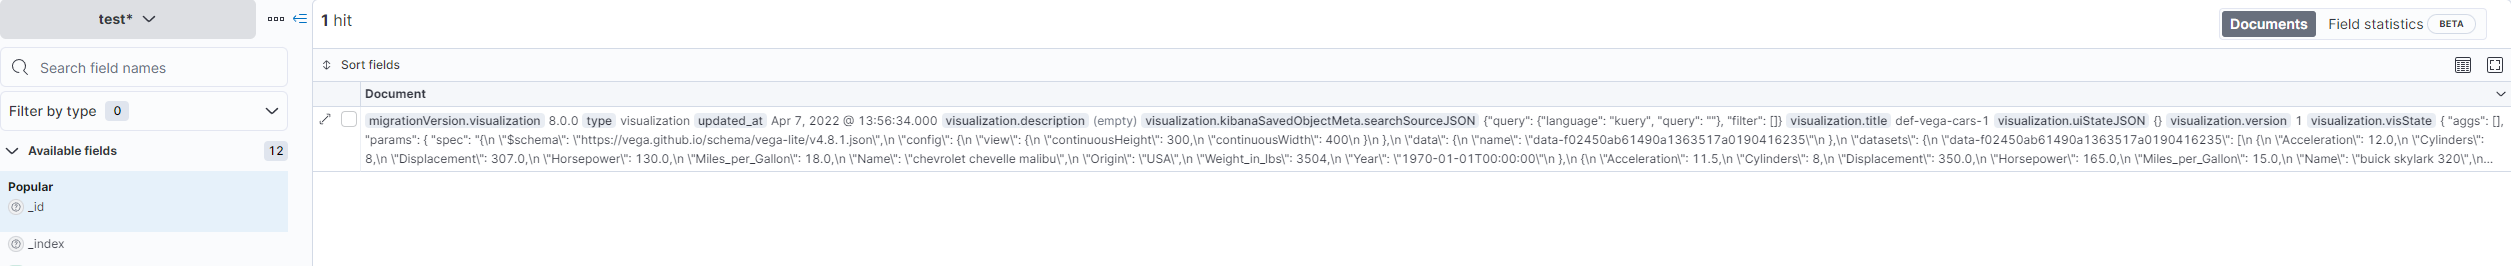
It seems to us that all of the traits for a visualization are there. To validate this, we exported a Vega visualization to observe the data structure (please excuse any oddities, the export leaves a lot of escape characters we tried to clean up):

    {
    	"attributes": {
    		"description": "",
    		"kibanaSavedObjectMeta": {
    			"searchSourceJSON": {
    			    "query ":{
    			        "query":"",
                        "language":"kuery"
                    },
                    "filter":[]
                }
    		},
    		"title": "TEST_VISUAL_PLZ_WORK",
    		"uiStateJSON": "{}",
    		"version": 1,
    		"visState": {
            "title":"TEST_VISUAL_PLZ_WORK",
            "type":"vega",
            "aggs":[],
            "params":{
                "spec":" {
    			"$schema": "https://vega.github.io/schema/vega/v3.json", n "width": 300, "height": 100, "data": [{
    				n "name": "vals",
    				n "values": [n {
    						"category": 50,
    						"count": 30
    					}, {
    						"category": 100,
    						"count": 80
    					}, {
    						"category": 150,
    						"count": 10
    					}, {
    						"category": 200,
    						"count": 50
    					}
    				]
    			}], "marks": [{
    			    "type": "rect",
    				"from": {
    					"data": "vals"
    				},
    				"encode": {
    					"update": {
    						"x": {
    							"field": "category"
    						},
    					    "width": {
    							"value": 30
    						},
    						"y": {
    							"field": "count"
    						},
    						"y2": {
    							"value": 0
    						}
    					}
    				}
    			}]
    
    		}
    		"}}"
    	},
    	"coreMigrationVersion": "8.1.2",
    	"id": "6e130cc0-b694-11ec-8df1-41f60ea92d87",
    	"migrationVersion": {
    		"visualization": "8.0.0"
    	},
    	"references": [],
    	"type": "visualization",
    	"updated_at": "2022-04-07T17:04:32.085Z",
    	"version": "WzYxOTQsMl0="
    } {
    	"excludedObjects": [],
    	"excludedObjectsCount": 0,
    	"exportedCount": 1,
    	"missingRefCount": 0,
    	"missingReferences": []
    }

And it seems our data structure matches this.

So are we going about this the wrong way? Is there some minor mistake? Is it possible to do (without disabling security protocols / 'hacking' it)?

I have to say that I wasn't aware of this ML project; it is genius!; the authorization problem could be solved easily; just create a role with privileges to run as "kiabana_system" and add to your Elastic client a header; something like this:

headers = {
    'es-security-runas-user': 'kibana_system'
}
cloud_id = "secret"
http_auth = ("username", "password")

es = Elasticsearch(cloud_id=cloud_id, http_auth=http_auth,
                    headers=headers)

However, even if the visualization gets saved directly to the kibana index; it doesn't get listed in the visualizations list, so this is not really a solution in the long term; the way to go is with the Kibana API and create a Saved Object; that should work on the long run. Having that in mind a quick modification of the example and buala... it works!:

def saveVegaVis(client, index, visName, altairChart):
    chart_json = json.loads(altairChart.to_json())
    chart_json['data']['url'] = {
        "%context%": True,
        "index": index,
        "body": { 
            "size": 10000
        }
    }

    visState = {
      "type": "vega",
      "aggs": [],
      "params": {
        "spec": json.dumps(chart_json, sort_keys=True, indent=4, separators=(',', ': ')),
      },
      "title": visName
    }

    visSavedObject={
        #"visualization" : {
        "attributes" : {
          "title" : visName,
          "visState" : json.dumps(visState, sort_keys=True, indent=4, separators=(',', ': ')),
          "uiStateJSON" : "{}",
          "description" : "",
          "version" : 1,
          "kibanaSavedObjectMeta" : {
            "searchSourceJSON" : json.dumps({
              "query": {
                "language": "kuery",
                "query": ""
              },
              "filter": []
            }),
          }
        }#,
        #"type" : "visualization",
        #"references" : [ ],
        #"migrationVersion" : {
        #  "visualization" : "7.7.0"
        #},
        #"updated_at" : datetime.datetime.now().strftime("%Y-%m-%dT%H:%M:%S.000Z")
    }

    import requests
    
    myurl = 'http://kib01:5601/api/saved_objects/visualization'

    headers = {
        'kbn-xsrf' : 'true',
        'Content-Type' : 'application/json'
    }
    
    x = requests.post(myurl, data=json.dumps(visSavedObject), auth=("myuser", "mysupersecretpass"), headers=headers)
    
    print(x.text)
    
    #return client.index(index='.kibana',id='visualization:'+visName,body=visSavedObject)

Thanks, this is awesome!

How do we use this API for non-local access? I didn't see any place for our API key in the headers, nor do I seem to be able to see what address endpoint Elastic is actually using (We're hosting it through Elastic's standard cloud service), maybe https://api.elastic-cloud.com/api/v1?

If that's the correct endpoint, their documentation doesn't do a great job of demoing how to set up a connection. I've seen documentations demo the API connection in 10 different languages, this one just demo's a GUI app lol.

Elastic has a Python client which we were obviously using in a our previous code, but for some reason I don't see any method in it designed for using the paths like you did in your code to hit that /api/saved_objects/visualization API endpoint.

Edit: Ok for the API key entry, I think I see it at https://cloud.elastic.co/api/v1/api-docs/spec.json, down at the bottom:

"security": [
        {
            "apiKey": []
        }
    ]

I don't have an Elastic Cloud at my disposition right now... but; if I recall correctly, there is a section in the cluster configuration where you could check the Kibana endpoint; the API that I'm using it's not the Elastic API; it's the Kibana API; so you must perform the request to that specific endpoint, that's why it's not part of Elastic Python client.

Thanks for all the info, extremely helpful. We struggled with this for a few days.

This topic was automatically closed 28 days after the last reply. New replies are no longer allowed.