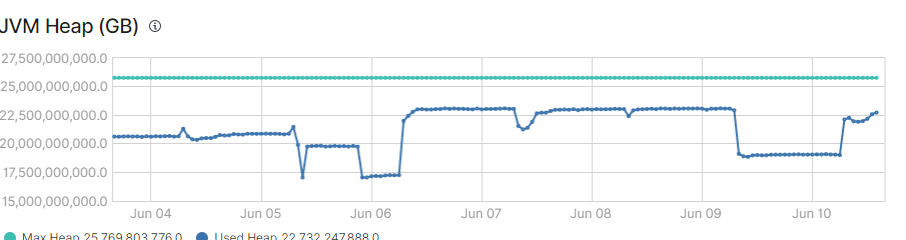
We have watchers setup to notify when our JVM increases over 85% we have noticed that once the watcher is triggered the alerts keep firing and the jvm usage never drops back down. Is this normal behavior?

We have 5 nodes - 40G RAM each JVM 20G
420 indices 956 shards
We have made several changes to try and help the alerts from triggering but nothing seems to be changing.