I am new to the ELK stack but have spent 2 days now trying o solve this
rather annoying issue,
Kibana 4 displays my number fields as strings/text fields and I cannot
perform any max/aggregate calculations on the field.
Logstash is configured to specifically type/cast/mutate the field to a
number. Elastic Search sees the fields as numbers. Even the JSON tab in
Kibana 4 shows it as a number.
However the rest of Kibana thinks its a string.
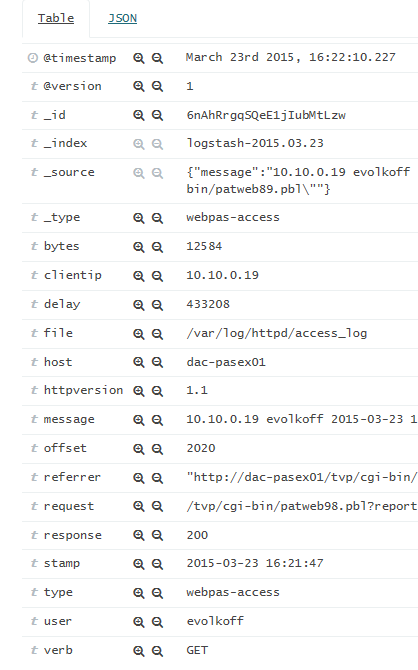
I have attached the Tabel view and The JSON view. I assume I should see a
different icon in the table view? Not the little "t"
Here is what I see on my latest event in Kibana...
https://lh3.googleusercontent.com/-PoyS22lCz0c/VQ-j0mX9aOI/AAAAAAAAD3s/eh6D_nh_rQ4/s1600/JSON_View.png
https://lh6.googleusercontent.com/-j7eNo3hQy9A/VQ-ju8VbU_I/AAAAAAAAD3k/nIuAUdWvQfA/s1600/Tabel_view.png
Some background...
I am consuming logs from an Apache Webserver log that was customised by the
application developer.
I use logstash-forwarder (logstash-forwarder-0.3.1-1.x86_64.rpm) to send
the logs from the production server to the ELK server.
Here is the logstash-forwader config...
{
"network": {
"servers": [ "elkserver.mydomain.net:5000" ],
"timeout": 15,
"ssl ca": "/etc/pki/tls/certs/logstash-forwarder.crt"
},
"files": [
{
"paths": [
"/var/log/httpd/access_log"
],
"fields": { "type": "webpas-access" }
}
]
}
And on the ELK server the logstash configuration....
input {
lumberjack {
port => 5000
type => "webpas-access"
ssl_certificate => "/etc/pki/tls/certs/logstash-forwarder.crt"
ssl_key => "/etc/pki/tls/private/logstash-forwarder.key"
}
}
filter {
grok {
type => "webpas-access"
pattern => "%{APACHE_WEBPAS}"
}
mutate {
convert => [ "delay", "integer" ]
}
}
output {
elasticsearch { host => localhost }
stdout { codec => rubydebug }
}
I added a custom pattern to Logstash. I added type values to the bytes and
delay fields. "Delay" is the field I am trying to measure and treat as a
number,
APACHE_WEBPAS %{IPORHOST:clientip} %{USERNAME:user}
%{TIMESTAMP_ISO8601:stamp} "(?:%{WORD:verb} %{NOTSPACE:request}(?:
HTTP/%{NUMBER:httpversion})?|%{DATA:rawrequest})" %{NUMBER:response}
(?:%{NUMBER:bytes:int}|-) %{WORD}=%{NUMBER:delay:int} %{WORD}=%{QS:referrer}
I installed Elastic HQ and checked the indexes...
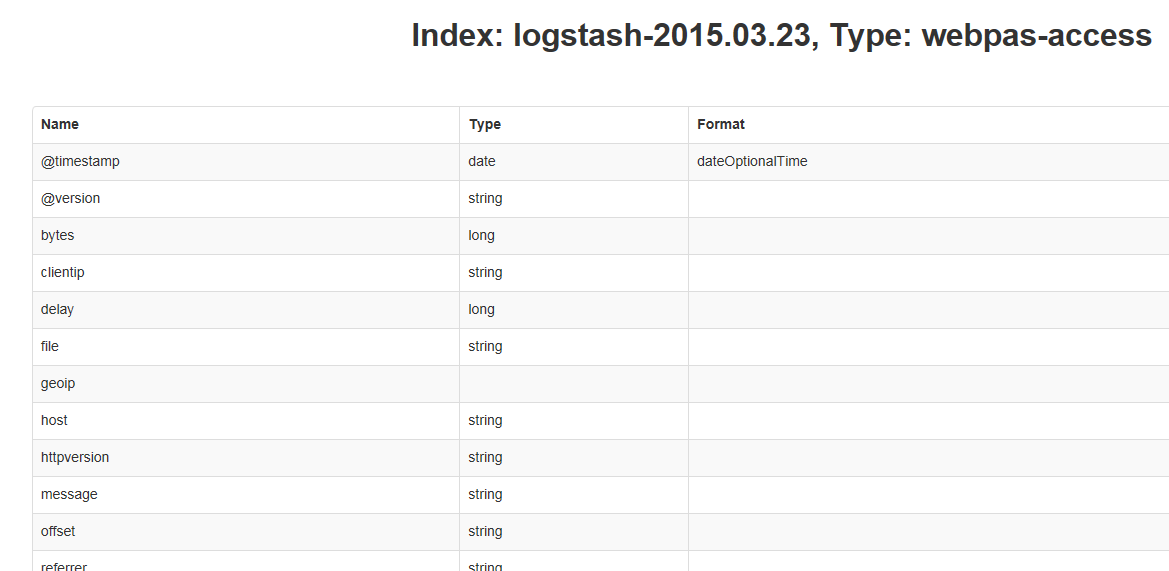
This looks to me like a problem in Kibana but I am very much out of ideas
on what to do next.
PS. I made changes to the grok pattern 2 days ago but could not work out
how to reset/refresh the index so I waited overnight for a new index to be
created. Still no joy.
Please help.
Aaran
--
You received this message because you are subscribed to the Google Groups "elasticsearch" group.
To unsubscribe from this group and stop receiving emails from it, send an email to elasticsearch+unsubscribe@googlegroups.com.
To view this discussion on the web visit https://groups.google.com/d/msgid/elasticsearch/870605d3-fbd1-4973-b151-e89679b4daa7%40googlegroups.com.
For more options, visit https://groups.google.com/d/optout.