Hello,
I am running Kibana 5 in DEV environment and trying to search for a url within 'last 7 days' filter. The search is taking a long time and timing out with "Request Timeout after 30000ms" message.
I am performing the same url search for last '7 days' on Kibana 4.5.4 running in PRODUCTION and i am able to get the results within seconds. My ELK 5 has been setup using default settings.
Is there a way i can improve the Kibana 5 performance? Please provide any suggestions on this as it is becoming a major issue on our end.
Any help is highly appreciated.
Hi, Can anyone provide any information on this problem. Its a major issue on our end as we cant go to higher environment like production with this kind of performance. Please take a look.
-Thanks
That seems very odd, but this isn't a lot of information to go on.
How many Elasticsearch nodes are running in your dev environment vs the production? What are the differences in the amount of data?
I am running Kibana 5 in DEV environment and trying to search for a url within 'last 7 days' filter.
If this is happening on a dashboard, how many visualizations are on the dashboard? Can you look at each visualization independently and see which one is taking the longest? Can you get the query for the slow visualization from the Spy panel, try it in the Console Dev Tool and see if the delay is the same when going straight to Elasticsearch without visualiztion rendering? How many docs are returning in that query - is that the count you expect?
@tsullivan,
In my dev (version 5) environment, I am running 2 nodes VS 1 node in production (version 2.4).
There is around 450 GB of data in PRO VS 100 GB of data in DEV.
I am not using any visualization in kibana. I am just performing a basic search using the default Discover kibana app.
When performing a search from dev tools console, i am getting the following message:
In production (running kibana 4.5 & ES 2.4.x) there is no latency. The max response times vary between 20-30 ms. I am facing latency only in DEV (running kibana 5 & ES 5.1) with the response time varying between 400-500 ms.
I meant, what is the baseline network latency you have between the dev host, subtracting server processing time? In other words, the speed of the network in between the client and the server.
Another thought, you might want to check that the status of the dev Elasticsearch cluster is Green.
@tsullivan, the ES cluster status has been for a long time.
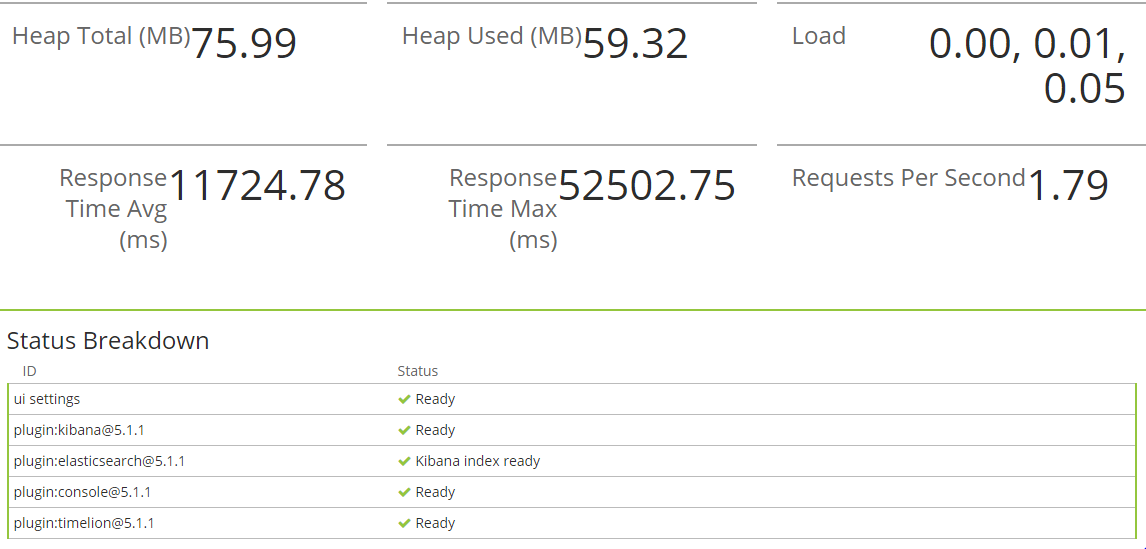
I am not sure but the i enabled inspect on the browser and following is the image i got when i ran the query for 'last 7 days filter'.
The requests that are timing out are the ones that reach out to Elasticsearch. Is there something between Kibana and Elasticsearch, like a proxy? In Your original screenshot, you noted the 504 Gateway Timeout error, which is generally the sign that a proxy is in-between and it's probably at fault here.
Can you use curl to run the same search you ran in the dev tools console? If that still doesn't work, you probably need to post that in the Elasticsearch forum.
@pickypg, But if the issue is due to proxy, then it should also stop me from doing regular searches right?
I am not sure if there is a proxy in between elasticsearch and kibana but i will want to give it a try. Do you know how i can configure proxy on kibana machine? Can you provide any links?
If the curl command is timing out, then it's absolutely not Kibana's fault -- it's at best Elasticsearch's fault. Chances are pretty good that either
Elasticsearch is somehow down. (Check its logs to see if an error is happening on your Elasticsearch cluster)
A proxy is in-between you and your cluster and the proxy is misbehaving.
Proxies can be made to hide, but most add a header to the response if you're looking for it. Can you copy the curl command here with its response and add -v to it to see its header output as well?
@pickypg, i checked the logs and there were no errors occurring on ES cluster. The cluster health is also GREEN.
Following is the response
*About to connect() to localhost port 9200 (#0)
*Trying ::1... Connected to localhost (::1) port 9200 (#0)
> GET /op-real-/_search HTTP/1.1
> User-Agent: curl/7.29.0
> Host: localhost:9200
> Accept: /
> Content-Length: 90
> Content-Type: application/x-www-form-urlencoded
>
*upload completely sent off: 90 out of 90 bytes
< HTTP/1.1 200 OK
< content-type: application/json; charset=UTF-8
< content-length: 10655
<
{"took":82208,"timed_out":false,"_shards":{"total":40,"successful":40,"failed":0},"hits":{"total":12114320,"max_score":20.308973,"hits":[{"_index":....
The request is taking Elasticsearch 82 seconds to process ("took": 82208). That's the problem we need to understand. Do you have your cluster setup to use X-Pack Monitoring? Is it running low on memory? Elasticsearch 5.x default's to using 2 GB of heap (configurable in /elasticsearch-directory/config/jvm.options).
Apache, Apache Lucene, Apache Hadoop, Hadoop, HDFS and the yellow elephant
logo are trademarks of the
Apache Software Foundation
in the United States and/or other countries.