I would like to have help on this "$?$&!!\$#$%@%" problem
I run ~70gb daily index size.. - 3 shards 1 replica on two server 64gb RAM, 31.94 heap size, 8 core CPU 3ghz
YET if I try to go over 12hours of data on a dashboard ( 7visualization or less it is really annoying as hell and didnt notice really any "pattern".. ) I get a damn kibana timeout...
Any of you guyz could give me a hand on this ?
Ive run test... HEAP Usage is ok..
apparrentely its really the cpu that goes sky high ( load average 14 15, cpu usage stick a 100% for a bunch of time )
Heap Usage is about 21gb out of 31.94gb ...
If you query a volume that returns without a timeout and look at the response, e.g. through Chrome developer tools, is there any visualisation that takes much longer then the others?
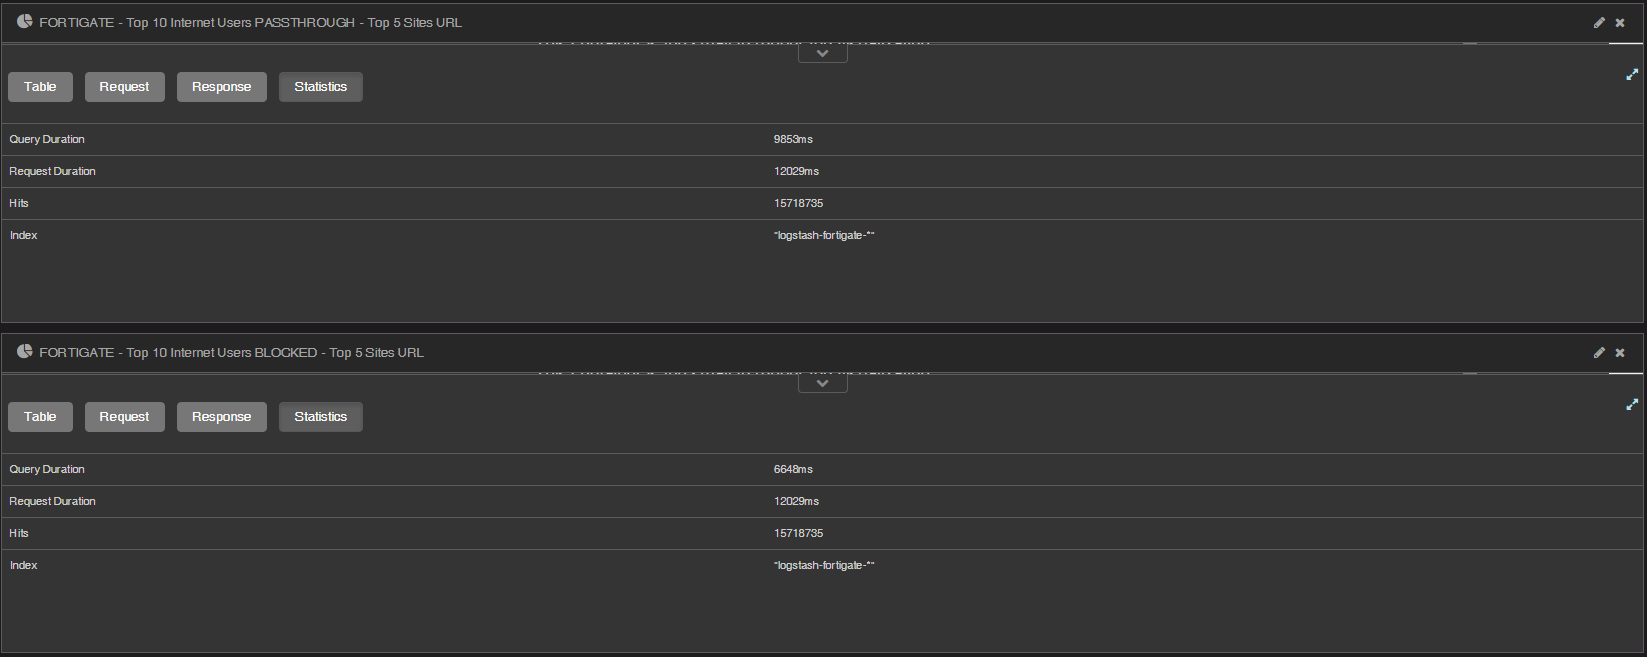
If you request a few hours worth of data, you should be able to view the statistics (which includes time the aggregation took to ran) for each visualisation from within Kibana. If you look at the different visualisations and how long they took, is there any that stands out?
In each visualisation there is an upwards arrow in the lower left corner. If you click on this you should see a button that says 'Statistics', which will provide this information.
It looks like you have some visualisations that require a lot of computation, especially the bottom one. If you are maxing out all CPU cores on both machines while querying, you may have hit the limit for what your cluster can handle, and may need to either try to make your dashboards less computationally intensive or scale out.
Upgrading to the latest 5.x release might actually help you. The 5.x releases have improved how caching works for indices covered entirely by the time period queried. If you used indices (with a single primary shard) that covered a smaller time period, e.g. a few hours, a good portion of the indices would be able to cache results for queries spanning longer time periods, resulting in faster response times. There is even a new rollover API that would allow you to create indices of a certain size irrespective of time period which may make this even easier to manage. The drawback with this approach is naturally that you may end up with a larger number of shards, which could become a problem for long term retention.
im running Siemonster Stack. its sort of all in one bundle with ossec etc...
so I assume its version dependant + you said that in the long term, I would have a problem with number of shards...
If we assume 4 hours per index with 1 primary and 1 replica shard, you would get 360 shards per month. With that 3 months online retention should be fine with your current setup. You may even be able to stretch it quite a bit further, so I would not worry about that.
Apart from upgrading or making the visualisations more light-weight, I do not really have any good suggestions at the moment. Maybe someone else will chime in?
Apache, Apache Lucene, Apache Hadoop, Hadoop, HDFS and the yellow elephant
logo are trademarks of the
Apache Software Foundation
in the United States and/or other countries.