I am configuring a Alert in Kibana. So in the alert, i need to add one more field for the count of errors. PFB the current Kibana message configured. I need to add the count of errors also in this. When i tried to use ** {{ctx.results[0].hits.total}} ** this, it is not showing the preview, also it was not triggering.
Can anyone help me correct this.
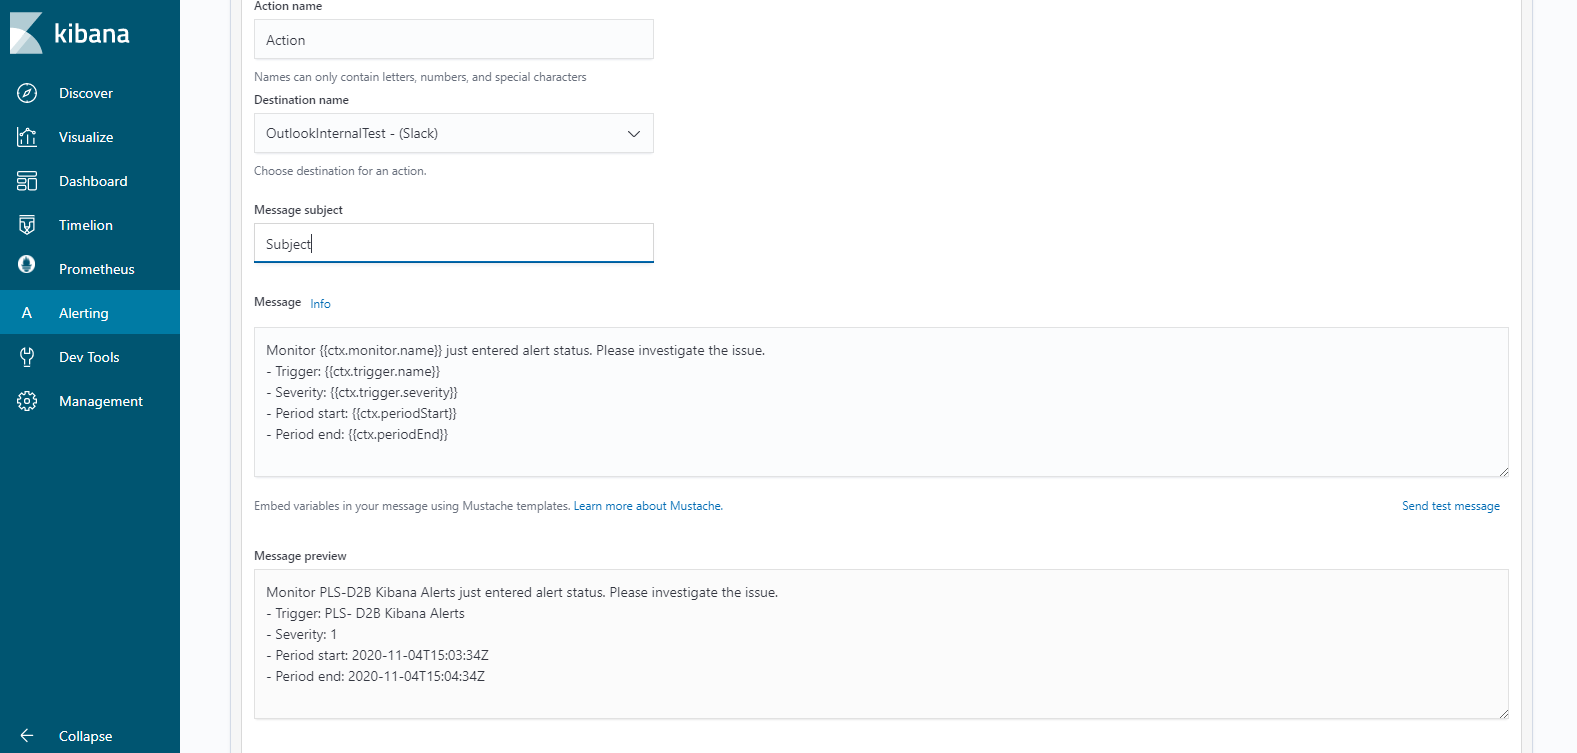
> Monitor {{ctx.monitor.name}} just entered alert status. Please investigate the issue.
> - Trigger: {{ctx.trigger.name}}
> - Severity: {{ctx.trigger.severity}}
> - Period start: {{ctx.periodStart}}
> - Period end: {{ctx.periodEnd}}
Hi @naveen_wilson ,
As Tim noted, looking at your configuration it looks like you're not in fact using Kibana's Alerting framework, but rather Amazon's OpenDistro for Elasticsearch.
This is not the Elastic distribution of Kibana, but rather an Amazon specific product (see the differences here). We unfortunately cannot offer support for Amazon's distribution, so you may have better luck asking in their forums.
Can you tell me is there anyway to confirm whether i am using open distro or Elastic distribution of Kibana. can i see it in Kibana?
Please see the below link
we are actually using this in our project. I dont know that much about the underlaying Tech but still i have a strong feeling that we are not using Amazon's OpenDistro for Elasticsearch.
We are using Kibana 6.7.1.
Please let me know your thoughts!
As per screenshots it's the Basic version of Kibana
Can you share a screenshot on how you create the alert in Kibana ? I'm not sure you use the alerting framework of Kibana, may be you use a custom plugin for alerting like ElastAlert or something else
Apache, Apache Lucene, Apache Hadoop, Hadoop, HDFS and the yellow elephant
logo are trademarks of the
Apache Software Foundation
in the United States and/or other countries.