Hi,
we imported several dashboards for uberAgent and try to bring them to the latest and greatest Kibana version. While still in test mode, we create some new visualizations and I have a problem.
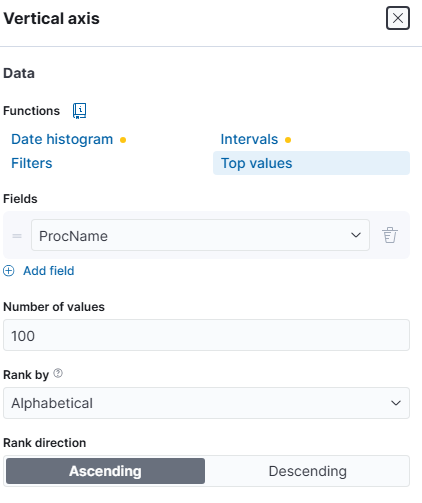
We have a list of processes with their average CPU and RAM usage over a period of time. In table mode, I can see all processes and their values and sort them correctly. I try to convert these information into two bar charts. ProcessName/avg CPU and ProcessName/avg RAM.
This is working fine, until I try to sort the bars. I try to sort by avg(CPU) or avg(RAM) and all values are empty. It doesn't matter if I sort asc or desc.
working:

Does someone have an idea, how to solve this problem? I'm fairly new to Kibana. Normally I use Grafana so basic concepts of dashboards and visualizations are present ![]()
Thanks
René