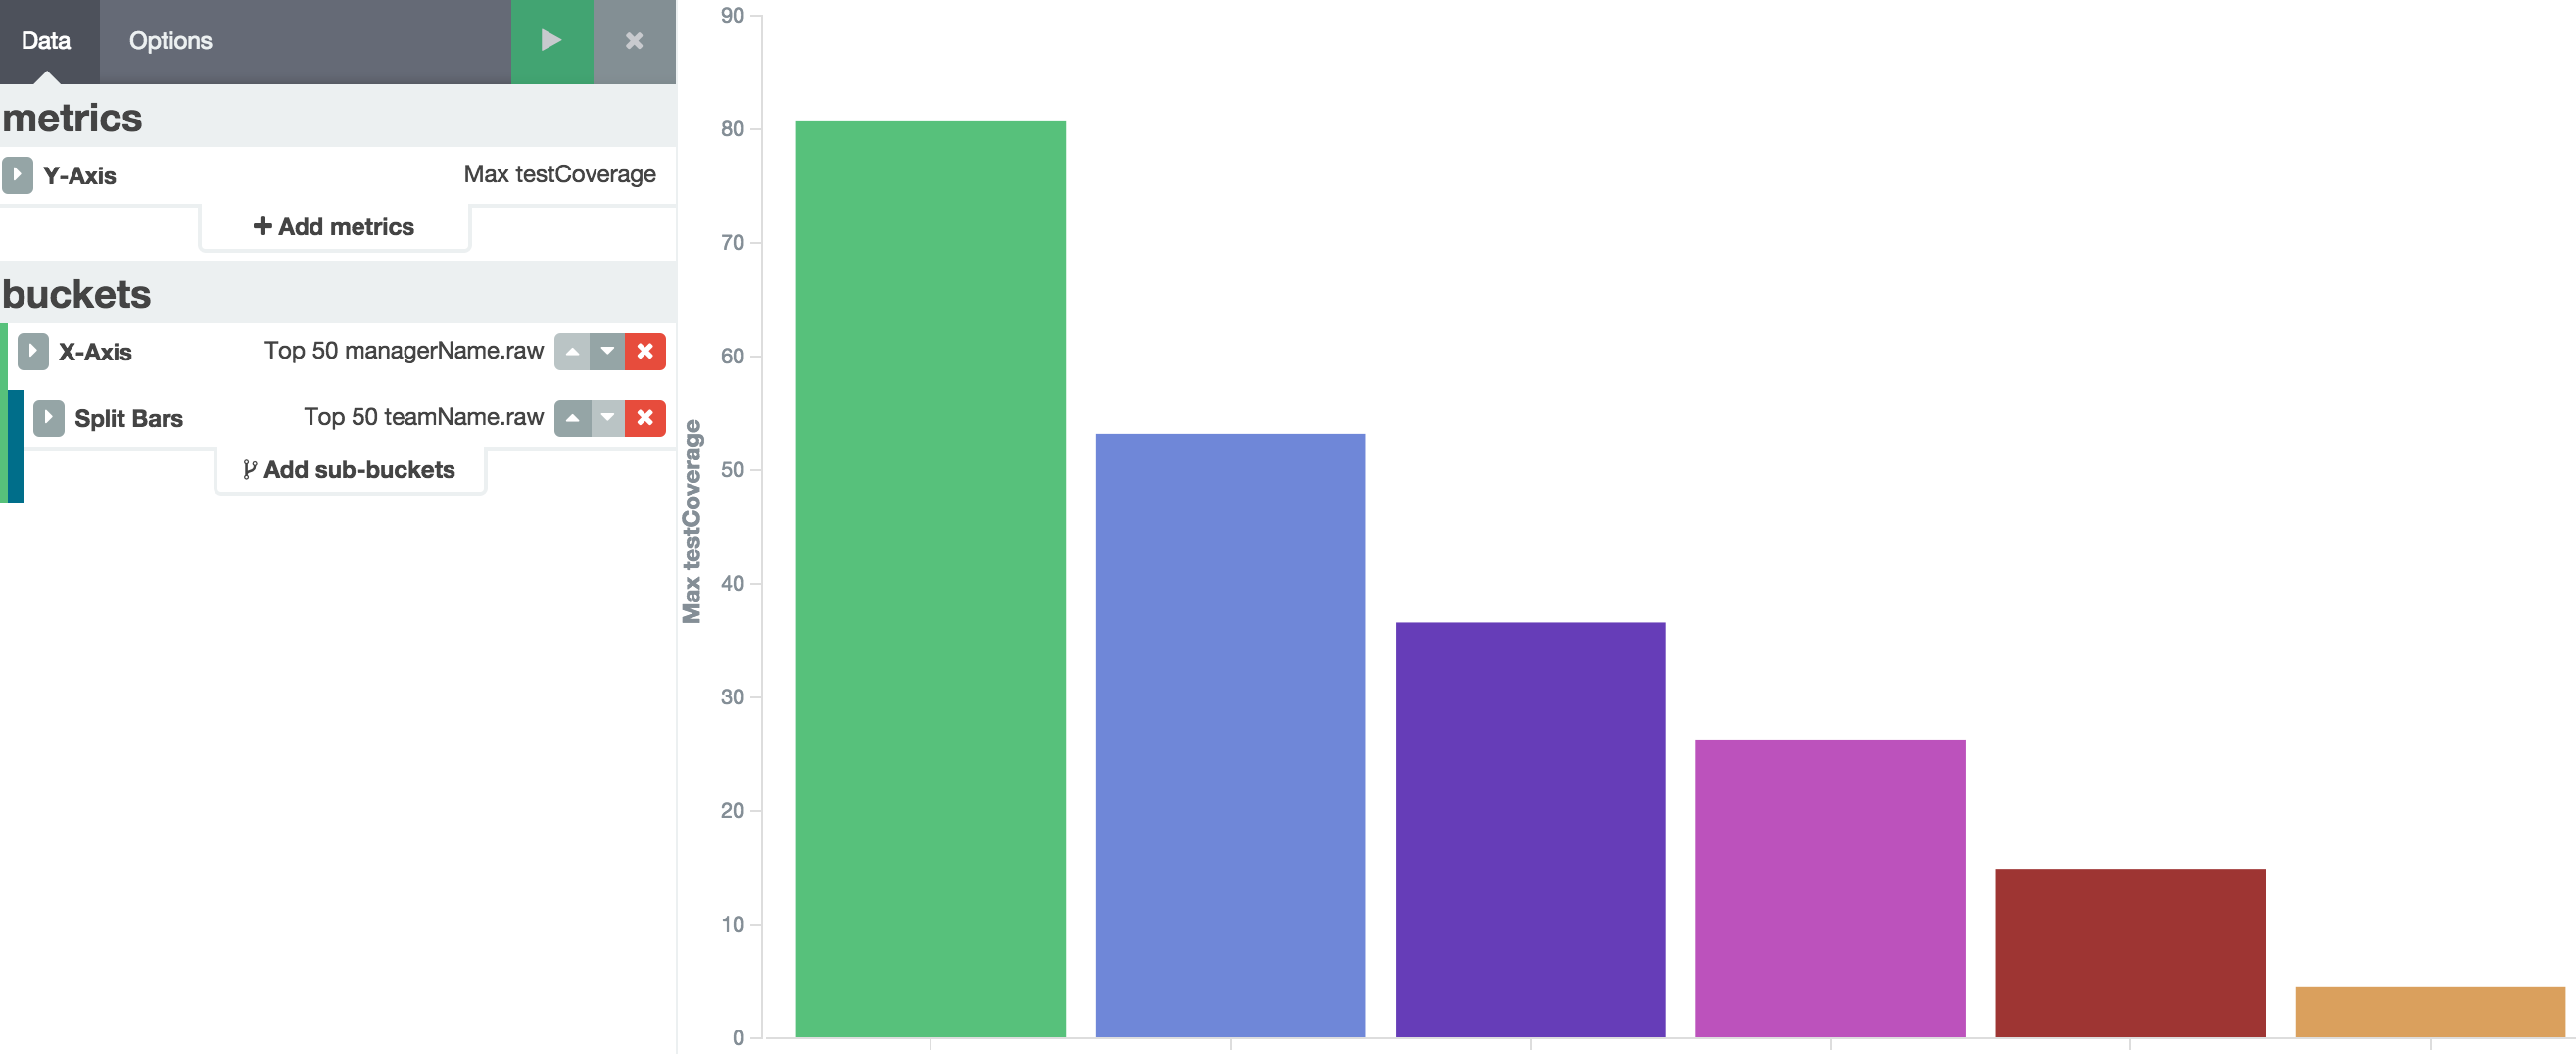
I'm using Kibana 4.1.2. I want to create a bar chart with the below details:
Manager name on x-axis and teams under him with unit test coverage.
I'm a new bie and facing trouble in creating bar chart.
I have the below filter
a filter in past 1 week sonarCreatedOn: [now-7d TO now]
Sample data:
{
  "took": 8,
  "timed_out": false,
  "_shards": {
    "total": 5,
    "successful": 5,
    "failed": 0
  },
  "hits": {
    "total": 4,
    "max_score": 1,
    "hits": [
      {
        "_index": "test-v1.0",
        "_type": "sonar",
        "_id": "AVJSMKQBpSv9QsmAakgk",
        "_score": 1,
        "_source": {
          "sonarCreatedOn": "2016-01-15T04:19:59.000-0700",
          "teamName": "Team 1",
          "managerName": "Manager 1",
          "directorName": "Director 1",
          "testCoverage": 49.5
        }
      },
      {
        "_index": "test-v1.0",
        "_type": "sonar",
        "_id": "BVJSMKQBpSv9QsmAakgk",
        "_score": 1,
        "_source": {
          "sonarCreatedOn": "2016-01-15T04:19:59.000-0700",
          "teamName": "Team 2",
          "managerName": "Manager 1",
          "directorName": "Director 1",
          "testCoverage": 10
        }
      },
      {
        "_index": "test-v1.0",
        "_type": "sonar",
        "_id": "BVJSMKQBpSv9QsmAakgk",
        "_score": 1,
        "_source": {
          "sonarCreatedOn": "2016-01-13T04:19:59.000-0700",
          "teamName": "Team 3",
          "managerName": "Manager 2",
          "directorName": "Director 1",
          "testCoverage": 70.4
        }
      },
      {
        "_index": "test-v1.0",
        "_type": "sonar",
        "_id": "BVJSMKQBpSv9QsmAakgk",
        "_score": 1,
        "_source": {
          "sonarCreatedOn": "2016-01-12T04:19:59.000-0700",
          "teamName": "Team 4",
          "managerName": "Manager 3",
          "directorName": "Director 2",
          "testCoverage": 0.2
        }
      }
    ]
  }
}