Kibana dashboard for Interface Traffic analysis

Hi,

I would like to monitor the traffic pattern in Kibana. Is there any pre-configured example dashboard available?. As I could monitor only bytes count. But I need to monitor the traffic in terms of bits/sec [ tools like MRTG / Cacti and so on].

Thanks

I'm not sure I completely understand the question. What is your source of data into Elasticsearch (e.g. which Logstash input, if you're using Logstash)? Pre-configured dashboards only really make sense with known log file formats and other standardized inputs.

My source data is from ntop for analyzing interface traffic.

There is no problem on inserting the value in Elasticsearch. my requirement is to visualize the interface bandwidth in bits/sec instead of bytes in Kibana. Is there any option available there ?.

Gotcha. No, there are no built-in dashboards for that at the moment.

Okay. Any planning to implement the same in future release ?.

And one more doubt, Is it possible to do bytes to bits conversion on Scripted field section on Kibana 4 ?.

There is definitely a possibility of something out-of-the-box in the future. We will be adding "recipes" and "apps" on top of the ELK stack in the future, so having something out-of-the-box for ntop is certainly a possibility.

For now, I see that there is a recent blog post on the ntop website describing how to monitor its traffic with ELK:

Regarding bytes conversions with scripted fields -- if you're talking about taking a numeric field and multiplying it by 8 to convert from bytes to bits, it should absolutely be possible.

Yeah :smile: already My setup is up and running based on the link you shared. All the data are visualized without any issue in ELK stack. Current concern right now is to expose the bytes data in kibana in terms of bits/sec.

I'm trying out with the same on Scripted field section on Kibana. lets see. :wink:

@tbragin Can you please share me the example scripted data field for bytes to bits conversion ? I tried locally. But couldn't get it done.

Sure - If your bytes field is called "IN_BYTES", you can use the following script:

doc['IN_BYTES'].value*8

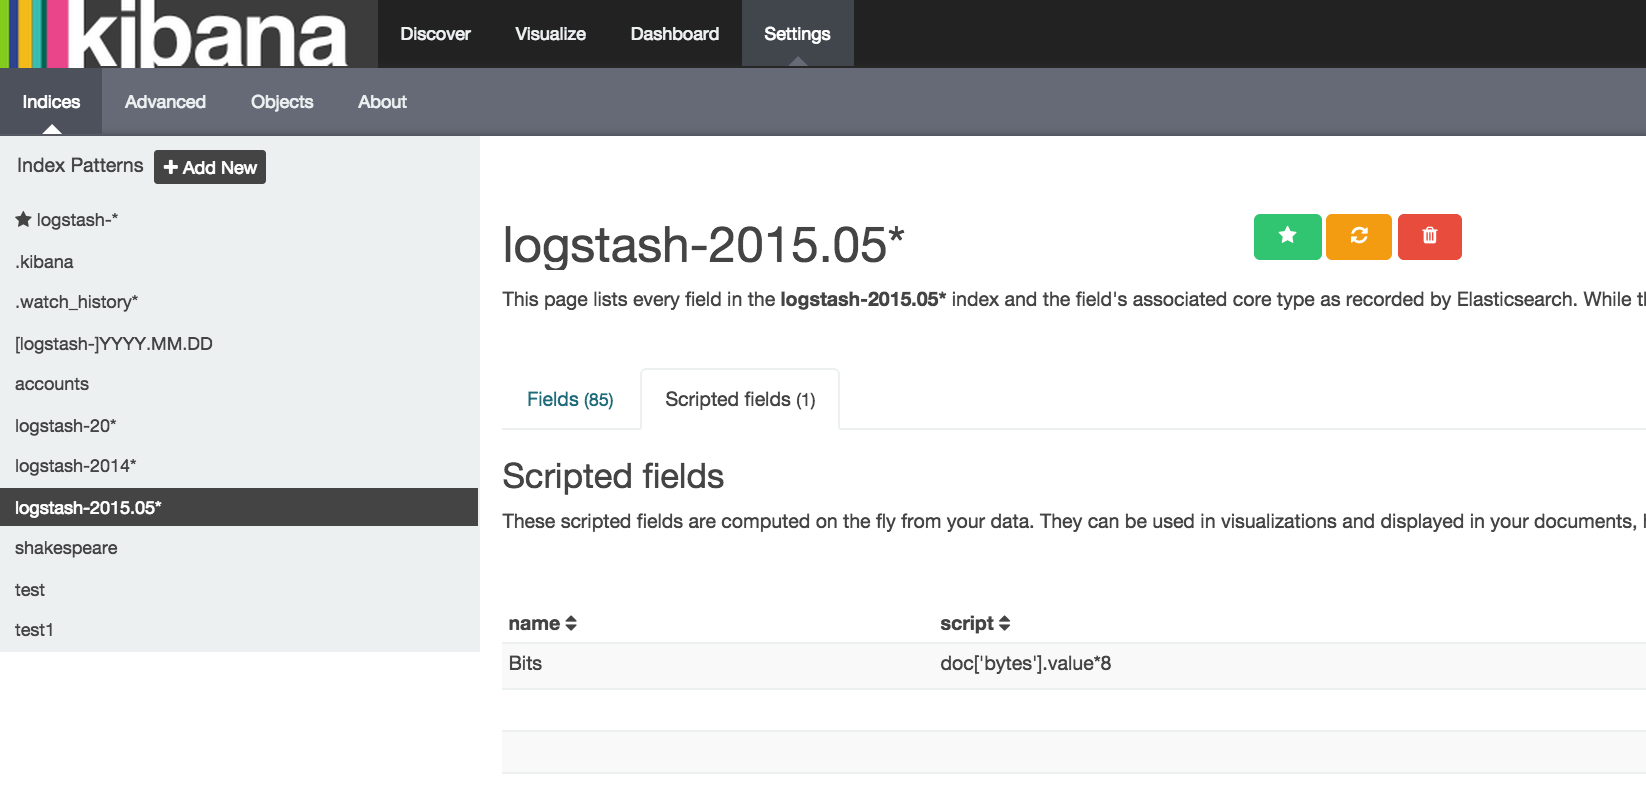
Some screenshots below from my environment (my bytes field is called 'bytes')

Thank you so much. I will have it check like you mentioned below

Tanya Bragin noreply@discuss.elastic.co wrote:

@tbragin , Yes I checked in my local env. Its working great.

One more question, How can I do adjustment for showing the Y axis values in terms of KB,MB and GB instead of showing raw value. ?. Its so hard to understand and also have to do manual calculation for converting those raw value into KB/MB/GB.

But, Kibana 3 is doing those stuff automatically [ showing up the value interms of KB, MB and GB].

Does Kibana 4 have those stuff internally ?. If it doesn't have such option, please let me know any way to achieve that.

Any idea on this ?.

You can use field formatters - check out this video: https://www.elastic.co/blog/kibana-4-1-field-formatters