message is a full text field, so it can't be aggregated. The existing visualizations that you see are doing one of two things:
Using a saved search from Discover, to see a data table exactly like what you see in Discover
Using the "Top hits" metric in Visualize, which is able to read from _source for only a few documents. This is most often used to show the "most recent" value of a full text field.
Just another question:
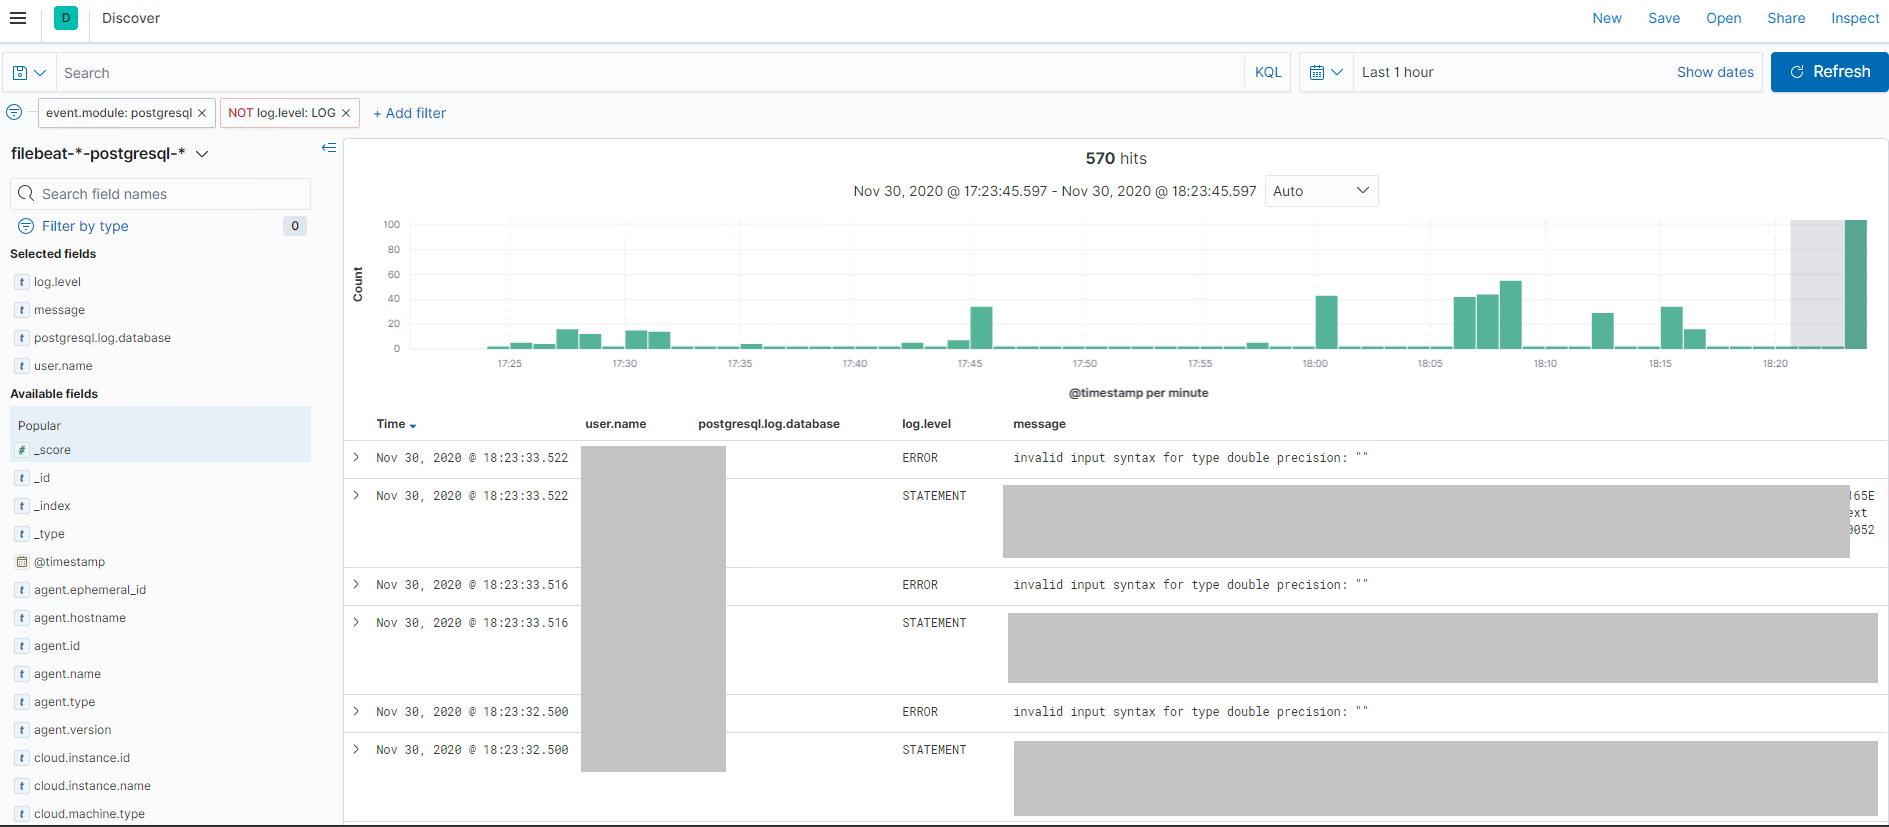
In "Discover" can i show only the distinct values from 'message' and add another column with the 'unique count' of those values? This is what i was trying to achive using the dashboard.
Thanks.
That would be possible if you could aggregate the message, but aggregations on full text fields are disabled by default with strong warnings against enabling it. Usually we would recommend extracting any meaningful values into a separate field that is aggregated. It is also possible to create a multi-mapped field for use with aggregation, and that might also suit your use case. More information in the docs: https://www.elastic.co/guide/en/elasticsearch/reference/current/text.html
Apache, Apache Lucene, Apache Hadoop, Hadoop, HDFS and the yellow elephant
logo are trademarks of the
Apache Software Foundation
in the United States and/or other countries.