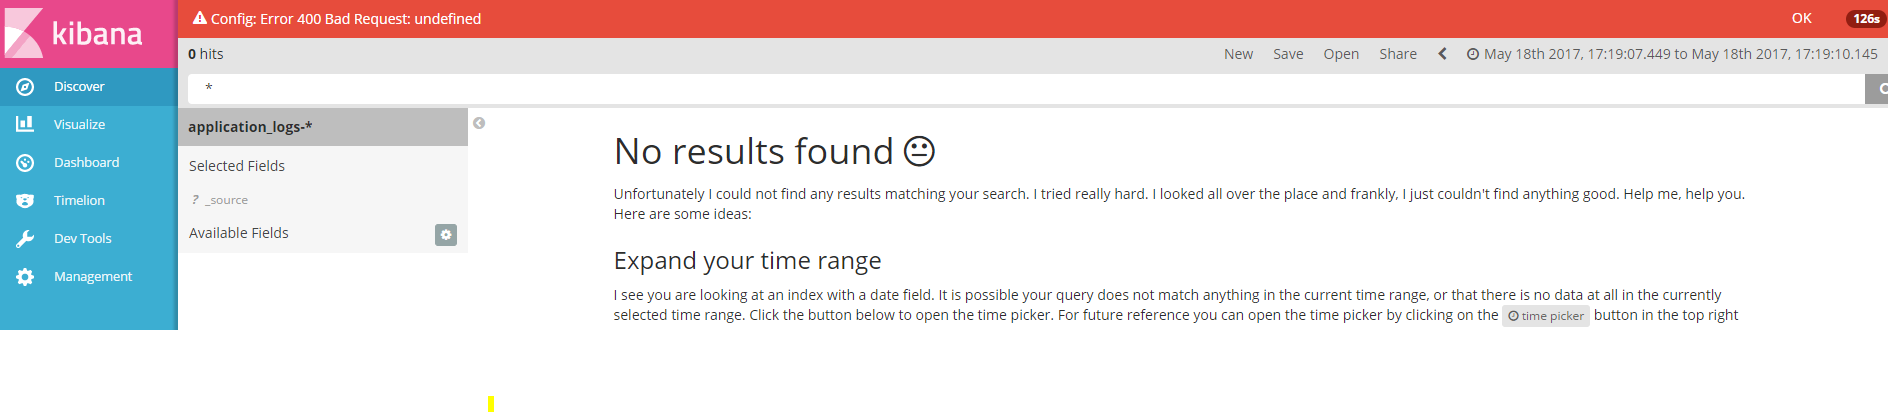
I'm worried where is my configuration is wrong. Everything looks working fine but when I open the browser is see "Config: Error 400 Bad Request: undefined". FYI I'm using the latest version 5.4.0.
Could you open browser's dev tools and see if there's an error in the console? Also you should be able to see the network request that failed, what was the request and response?
@Bargs small correction i'm using 5.3.2 version.
I don't see any error when I open dev tools and the request was successful
i'm getting that error when I click on the available fields
You mean when you click the gear icon next to the Available Fields label?
That's odd you're not seeing any failed request in the dev tools network tab. The error there is reporting a 400 bad request, which shouldn't be displayed unless there was a failed request.

Huh, that's really odd. Without any stack trace or network errors I'm at a bit of a loss. Is there anything unusual about your setup, or steps that you can think of that would help me reproduce?