Currently we have a large Dashboard displaying multiple visualizations. However, since 8.4.0 we encounter on the following message on two table views in Kibana. I'm not sure if it is a problem with a timeout or response size or anything. It seems to happen on Dashboards with a lot of visualizations. When i go into "Inspect" of the visualization i see the data but it is displayed as in the following screenshot:
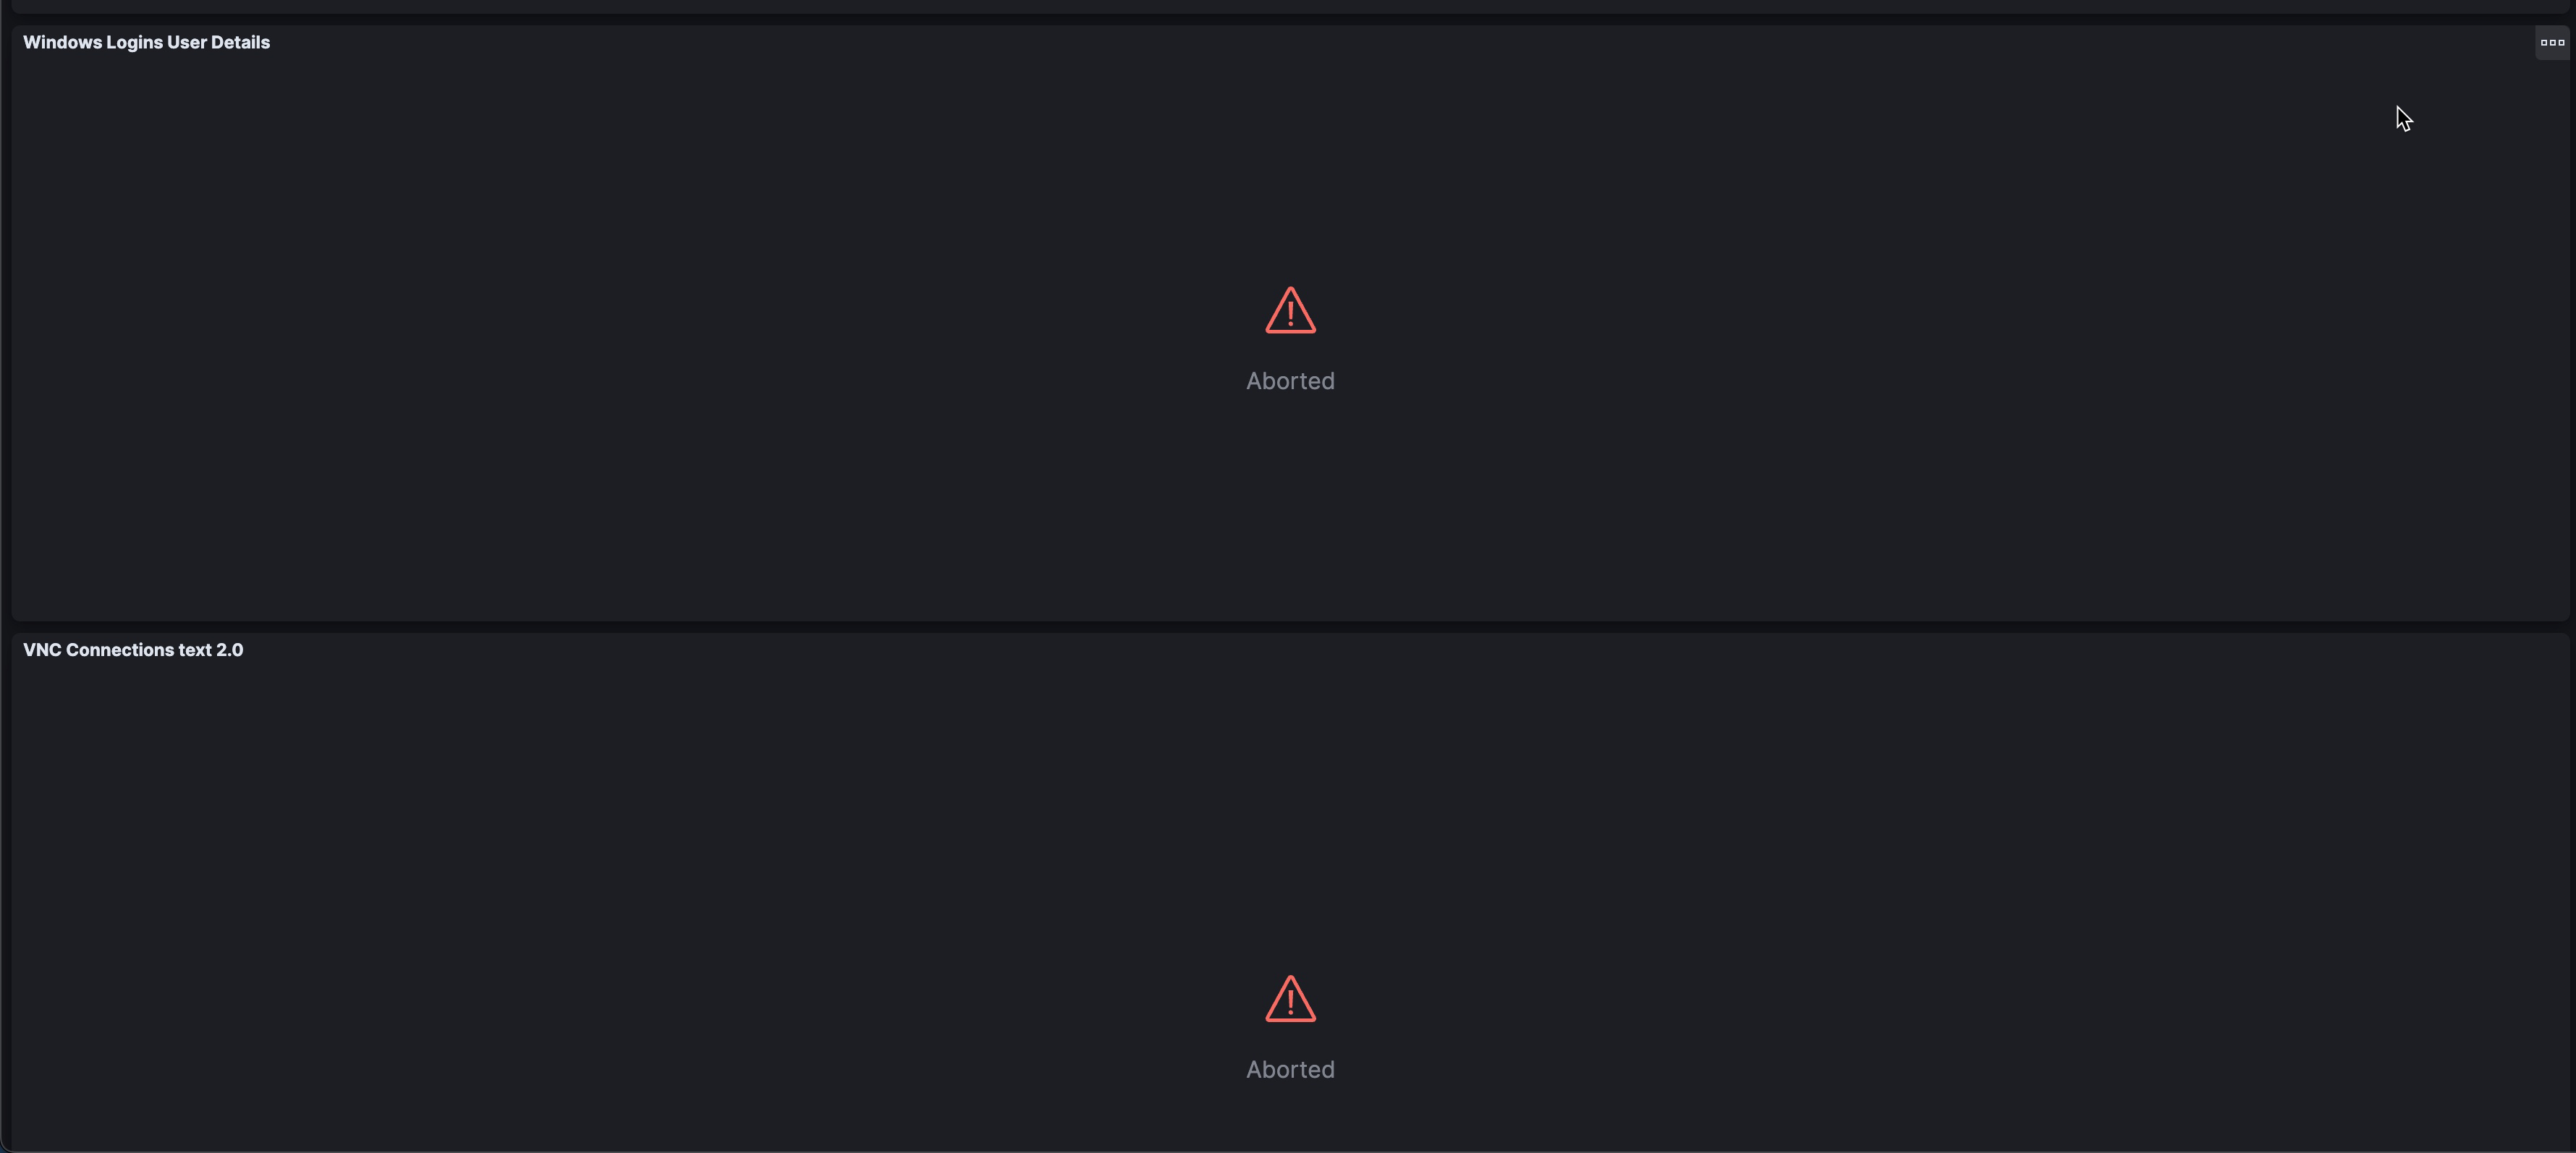
After clicking on the refresh button the data is displayed correctly but on the initial load of the dashboard it shows as aborted.