I'm finding it a little challenging in developing dashboards beyond a line and pie chart. Looking for advice from kibana experts who can guide me towards resources or personal tips and tricks.
Given the python script, dataset (metadata), and screenshots what line of code or data am I missing to achieving the "desired dashboard" (pictured below)?
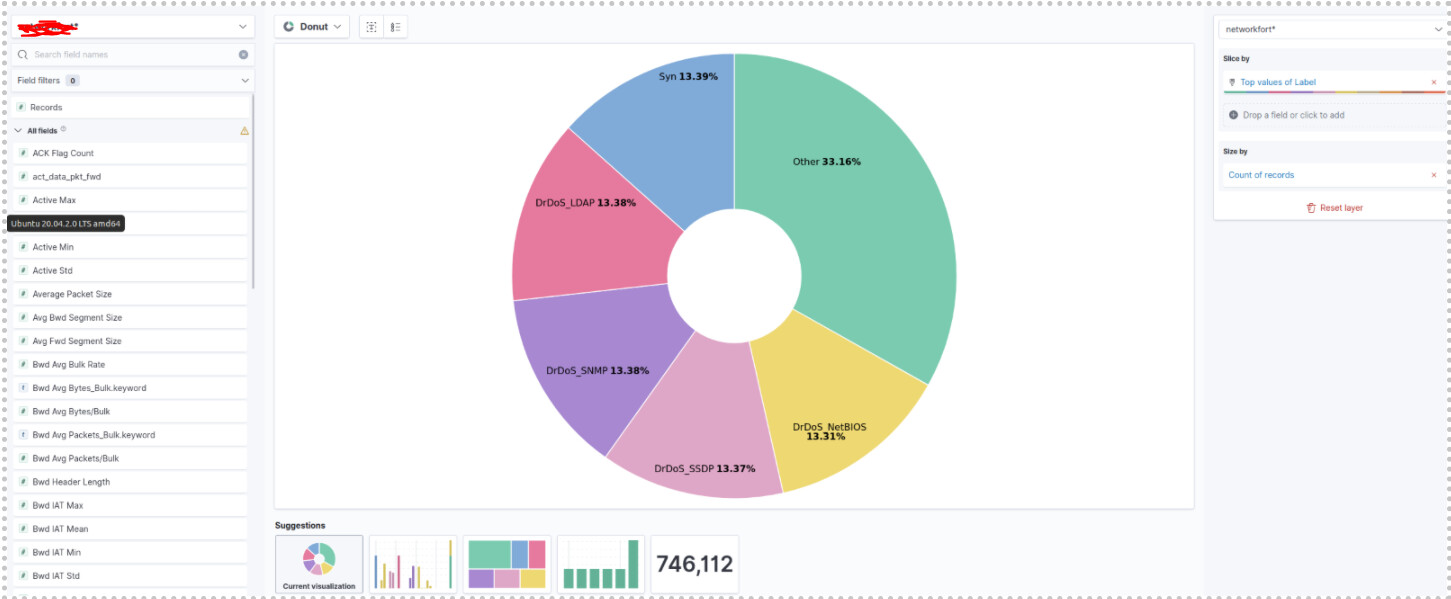
I will attach my current dashboard progress and dataset link for reference.
My goal is to use DDOS datasets to generate intricate dashboards and insightful GUIs, and use that as a template later for when I want to run real data and apply Machine Learning on top of it.


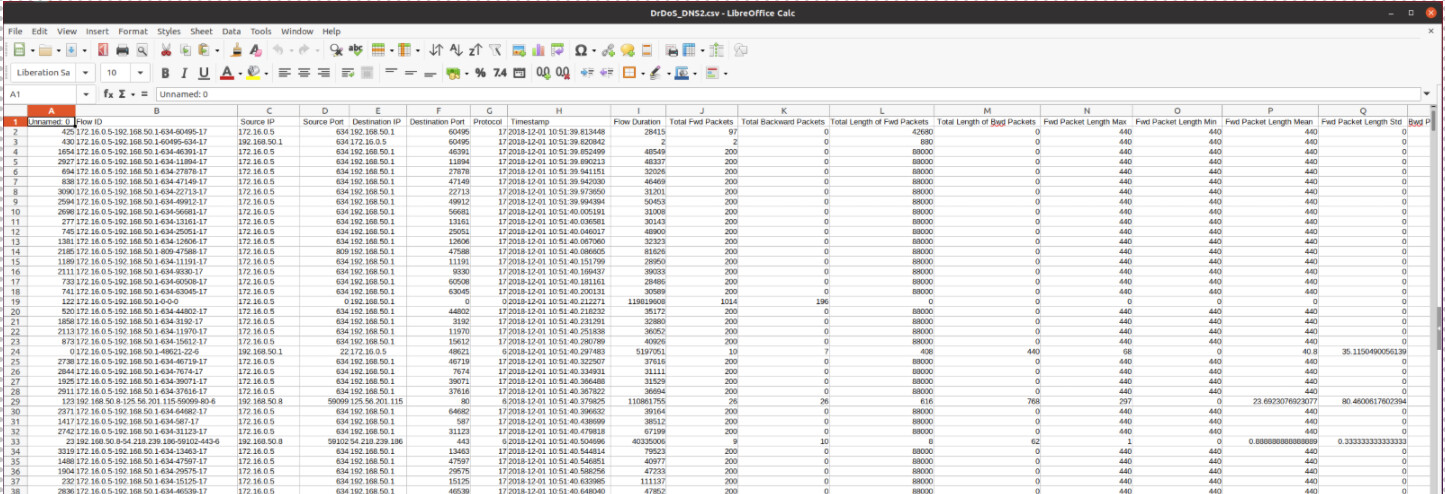
Dataset Link: DDoS 2019 | Datasets | Research | Canadian Institute for Cybersecurity | UNB
csv files


Python Script
import glob
from elasticsearch import Elasticsearch
from elasticsearch import helpers
from elasticsearch import ElasticsearchException
import csv
import json

path = "*.csv"

mapping = {
    "settings": {
        "number_of_shards": "2",
        "number_of_replicas": "0"},
    "mappings": {
        "properties": {
            "Timestamp": {
                "type": "date",
                "format": "yyyy-MM-dd HH:mm:ss.SSSSSS"
            },
            "Unnamed: 0": {
                "type": "long"
            },
            "Flow ID": {
                "type": "text"
            },"Source IP":{"type":"keyword"},"Source Port":{"type":"long"},"Destination IP":{"type":"keyword"},"Destination Port":{"type":"long"},"Protocol":{"type":"long"},"Flow Duration":{"type":"long"},"Total Fwd Packets":{"type":"long"},"Total Backward Packets":{"type":"long"},"Total Length of Fwd Packets":{"type":"long"},"Total Length of Bwd Packets":{"type":"long"},"Fwd Packet Length Max":{"type":"long"},"Fwd Packet Length Min":{"type":"long"},"Fwd Packet Length Mean":{"type":"long"},"Fwd Packet Length Std":{"type":"long"},"Bwd Packet Length Max":{"type":"long"},"Bwd Packet Length Min":{"type":"long"},"Bwd Packet Length Mean":{"type":"long"},"Bwd Packet Length Std":{"type":"long"},"Flow Bytes/s":{"type":"long"},"Flow Packets/s":{"type":"long"},"Flow IAT Mean":{"type":"long"},"Flow IAT Std":{"type":"long"},"Flow IAT Max":{"type":"long"},"Flow IAT Min":{"type":"long"},"Fwd IAT Total":{"type":"long"},"Fwd IAT Mean":{"type":"long"},"Fwd IAT Std":{"type":"long"},"Fwd IAT Max":{"type":"long"},"Fwd IAT Min":{"type":"long"},"Bwd IAT Total":{"type":"long"},"Bwd IAT Mean":{"type":"long"},"Bwd IAT Std":{"type":"long"},"Bwd IAT Max":{"type":"long"},"Bwd IAT Min":{"type":"long"},"Fwd PSH Flags":{"type":"long"},"Bwd PSH Flags":{"type":"long"},"Fwd URG Flags":{"type":"long"},"Bwd URG Flags":{"type":"long"},"Fwd Header Length":{"type":"long"},"Bwd Header Length":{"type":"long"},"Fwd Packets/s":{"type":"long"},"Bwd Packets/s":{"type":"long"},"Min Packet Length":{"type":"long"},"Max Packet Length":{"type":"long"},"Packet Length Mean":{"type":"long"},"Packet Length Std":{"type":"long"},"Packet Length Variance":{"type":"long"},"FIN Flag Count":{"type":"long"},"SYN Flag Count":{"type":"long"},"RST Flag Count":{"type":"long"},"PSH Flag Count":{"type":"long"},"ACK Flag Count":{"type":"long"},"URG Flag Count":{"type":"long"},"CWE Flag Count":{"type":"long"},"ECE Flag Count":{"type":"long"},"Down/Up Ratio":{"type":"long"},"Average Packet Size":{"type":"long"},"Avg Fwd Segment Size":{"type":"long"},"Avg Bwd Segment Size":{"type":"long"},"Fwd Header Length1":{"type":"long"},"Fwd Avg Bytes/Bulk":{"type":"long"},"Fwd Avg Packets/Bulk":{"type":"long"},"Fwd Avg Bulk Rate":{"type":"long"},"Bwd Avg Bytes/Bulk":{"type":"long"},"Bwd Avg Packets/Bulk":{"type":"long"},"Bwd Avg Bulk Rate":{"type":"long"},"Subflow Fwd Packets":{"type":"long"},"Subflow Fwd Bytes":{"type":"long"},"Subflow Bwd Packets":{"type":"long"},"Subflow Bwd Bytes":{"type":"long"},"Init_Win_bytes_forward":{"type":"long"},"Init_Win_bytes_backward":{"type":"long"},"act_data_pkt_fwd":{"type":"long"},"min_seg_size_forward":{"type":"long"},"Active Mean":{"type":"long"},"Active Std":{"type":"long"},"Active Max":{"type":"long"},"Active Min":{"type":"long"},"Idle Mean":{"type":"long"},"Idle Std":{"type":"long"},"Idle Max":{"type":"long"},"Idle Min":{"type":"long"},"SimillarHTTP":{"type":"text"},"Inbound":{"type":"long"},"Label":{"type":"keyword"}}}}
print(mapping)

for url in glob.glob(path):
    print(url.split('.')[0].lower())
    index_name = "fort_"url.split('.')[0].lower()
    es = Elasticsearch(['34.82.167.113:9200'])
    print(es.indices.delete(index=index_name, ignore=[400, 404]))
    response = es.indices.create(
        index=index_name,
        body=mapping,
        ignore=400  # ignore 400 already exists code
    )
    print('response:', response)
    iterator = 0
    batch = 0
    tmp_array = []
    batch_size = 200
    with open(url) as csv_file:
        csv_reader = csv.reader(csv_file, delimiter=',')
        next(csv_reader, None)
        for line in csv_reader:
            iterator = iterator  1
            tmp_array.append(line)
            if iterator == batch_size  1:
                batch = batch  1
                print(str(batch)  'th batch processed..')
                actions = []
                for row in tmp_array:
                    doc = {
                        'Unnamed 0': row[0],
                        'Flow ID': row[1],
                        'Source IP': row[2],
                        'Source Port': row[3],
                        'Destination IP': row[4],
                        'Destination Port': row[5],
                        'Protocol': row[6],
                        'Timestamp': row[7],
                        'Flow Duration': row[8],
                        'Total Fwd Packets': row[9],
                        'Total Backward Packets': row[10],
                        'Total Length of Fwd Packets': row[11],
                        'Total Length of Bwd Packets': row[12],
                        'Fwd Packet Length Max': row[13],
                        'Fwd Packet Length Min': row[14],
                        'Fwd Packet Length Mean': row[15],
                        'Fwd Packet Length Std': row[16],
                        'Bwd Packet Length Max': row[17],
                        'Bwd Packet Length Min': row[18],
                        'Bwd Packet Length Mean': row[19],
                        'Bwd Packet Length Std': row[20],
                        'Flow Bytes': row[21],
                        'Flow Packets': row[22],
                        'Flow IAT Mean': row[23],
                        'Flow IAT Std': row[24],
                        'Flow IAT Max': row[25],
                        'Flow IAT Min': row[26],
                        'Fwd IAT Total': row[27],
                        'Fwd IAT Mean': row[28],
                        'Fwd IAT Std': row[29],
                        'Fwd IAT Max': row[30],
                        'Fwd IAT Min': row[31],
                        'Bwd IAT Total': row[32],
                        'Bwd IAT Mean': row[33],
                        'Bwd IAT Std': row[34],
                        'Bwd IAT Max': row[35],
                        'Bwd IAT Min': row[36],
                        'Fwd PSH Flags': row[37],
                        'Bwd PSH Flags': row[38],
                        'Fwd URG Flags': row[39],
                        'Bwd URG Flags': row[40],
                        'Fwd Header Length': row[41],
                        'Bwd Header Length': row[42],
                        'Fwd Packetss': row[43],
                        'Bwd Packets': row[44],
                        'Min Packet Length': row[45],
                        'Max Packet Length': row[46],
                        'Packet Length Mean': row[47],
                        'Packet Length Std': row[48],
                        'Packet Length Variance': row[49],
                        'FIN Flag Count': row[50],
                        'SYN Flag Count': row[51],
                        'RST Flag Count': row[52],
                        'PSH Flag Count': row[53],
                        'ACK Flag Count': row[54],
                        'URG Flag Count': row[55],
                        'CWE Flag Count': row[56],
                        'ECE Flag Count': row[57],
                        'Down_Up Ratio': row[58],
                        'Average Packet Size': row[59],
                        'Avg Fwd Segment Size': row[60],
                        'Avg Bwd Segment Size': row[61],
                        'Fwd Header Length1': row[62],
                        'Fwd Avg Bytes_Bulk': row[63],
                        'Fwd Avg Packets_Bulk': row[64],
                        'Fwd Avg Bulk Rate': row[65],
                        'Bwd Avg Bytes_Bulk': row[66],
                        'Bwd Avg Packets_Bulk': row[67],
                        'Bwd Avg Bulk Rate': row[68],
                        'Subflow Fwd Packets': row[69],
                        'Subflow Fwd Bytes': row[70],
                        'Subflow Bwd Packets': row[71],
                        'Subflow Bwd Bytes': row[72],
                        'Init_Win_bytes_forward': row[73],
                        'Init_Win_bytes_backward': row[74],
                        'act_data_pkt_fwd': row[75],
                        'min_seg_size_forward': row[76],
                        'Active Mean': row[77],
                        'Active Std': row[78],
                        'Active Max': row[79],
                        'Active Min': row[80],
                        'Idle Mean': row[81],
                        'Idle Std': row[82],
                        'Idle Max': row[83],
                        'Idle Min': row[84],
                        'SimillarHTTP': row[85],
                        'Inbound': row[86],
                        'Label': row[87]
                    }
                    #print(doc)
                    action = [{"_source": doc}]
                    actions.append(action[0])
                try:
                    response = helpers.bulk(es, actions, index=index_name)
                    print("\nRESPONSE:", response)
                except ElasticsearchException as e:
                    print("\nERROR:", e)
                iterator = 0
                tmp_array = []
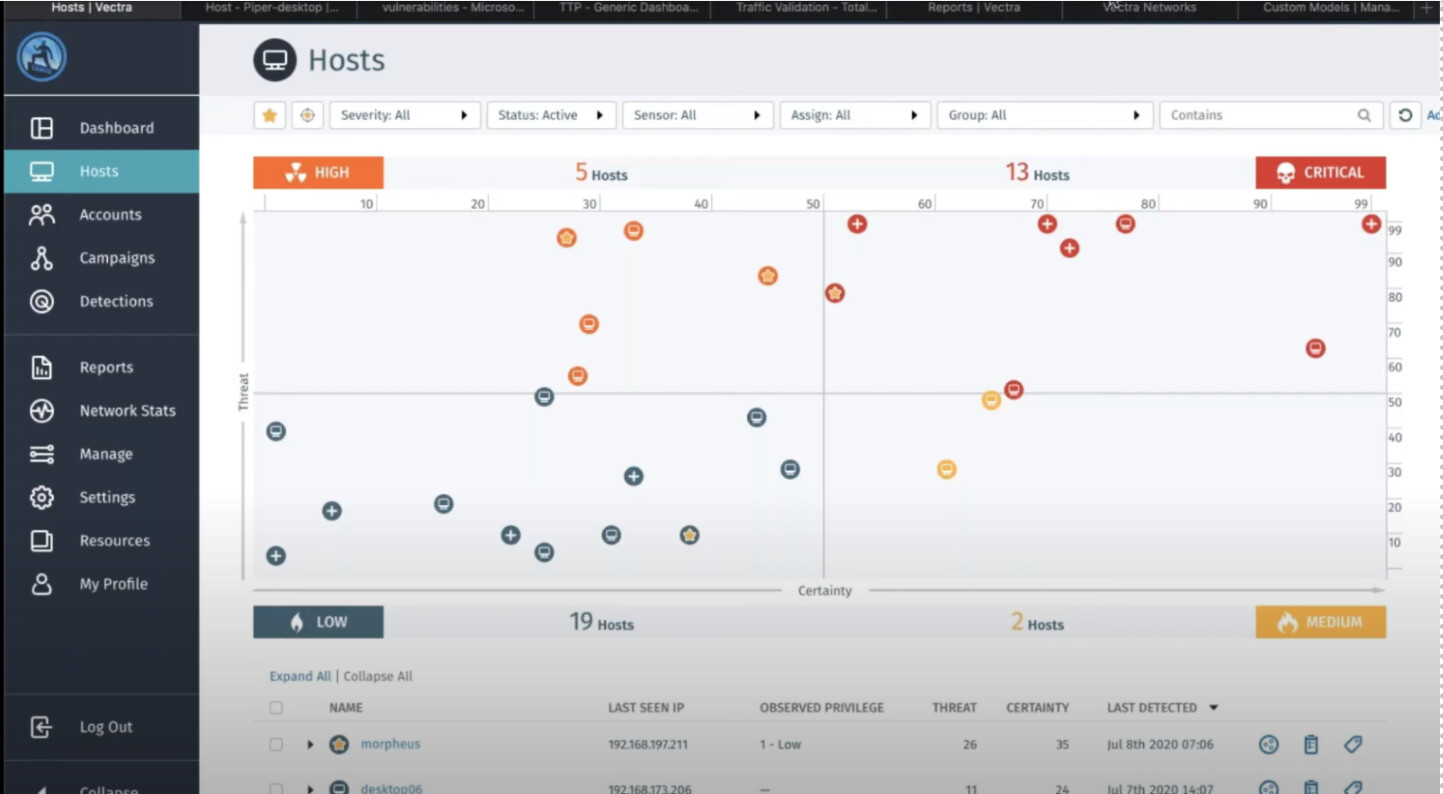
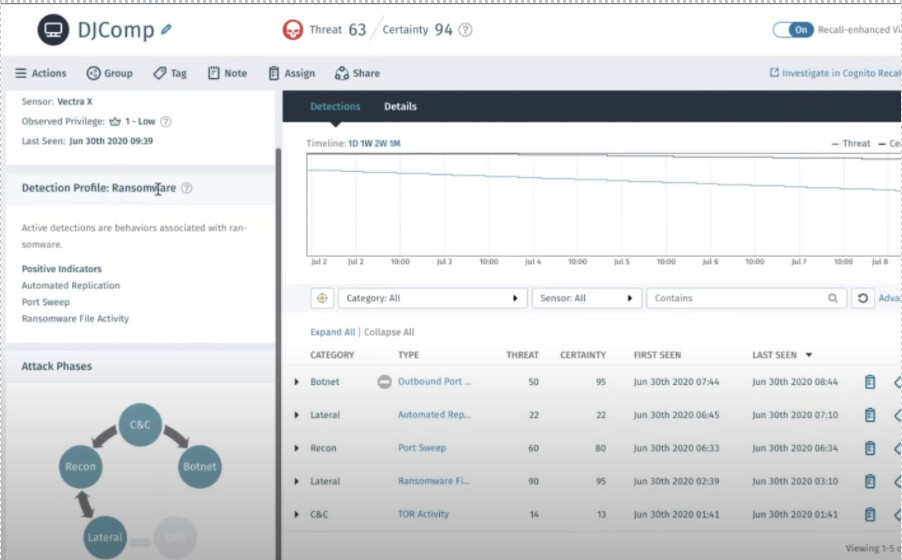
The desired dashboard as follows:
YT video: Ai-Driven Threat Detection & Response – Vectra Webinar - YouTube


 . Which is how I found out about vega-lite and D3js.