Hello ElasticTeam,
This is ingeneral feedback after working with two customers on elk stack usecases majorly with beats,kibana and logstash.
In my opinion there is scope of lot of improvement to provide many visualization type in kibana.
Every time customers ask if something can be done in visualization end to give good look and feel of dashboards then there is not much to say.
Example: Plugins like Enhanced table are great features and need of the hour.Such things should be looked into and supported by elastic itself. Apart from this modern visualization tools provide lot of customization and with kibana it seems not much possible.
Playing with data in visualization using custom css,html and js also is not supported much.(Ofcourse vega is there but intention is to use out of the box visual types kibana provides)
Few example:
Ex: Simple requirement was there display bar chart of the comapany names. Here requirement was to display at 1st position- Barclays, 2d position-Siemens....etc.(Not on based of counts or alphabatically but custom name on custom position)
Cluping of visuals as part of 1 unit :ex tomcat visual should be in one box,with its background color, and tomcat with its visuals with its bck color to distinguish.
Likewise after several usecases I have many points but crux is kibana visulization type are quite limited and customization is also limited to play with data.
Intention to post: Post our implementaion with customers and feedback it was decided that ELK based solution alternative should be looked into for future customers.
Points:
A simple google for following:
Alerting dashboards:(Compare elk visuals with GRAPHANA and PROM)
Tools like Tableau and Power Bi for Visulization
ADVANCED TABLE FUNCTIONALITY Like pivoting etc and many more.
Above are few points were bare minimum asked to look into going fwd to recommend customer.
Not sure if kibana visulization team or someone looks into this.I see scope to add more powerful visulization in kibana with various visulization types- comparing with competitor in this space.
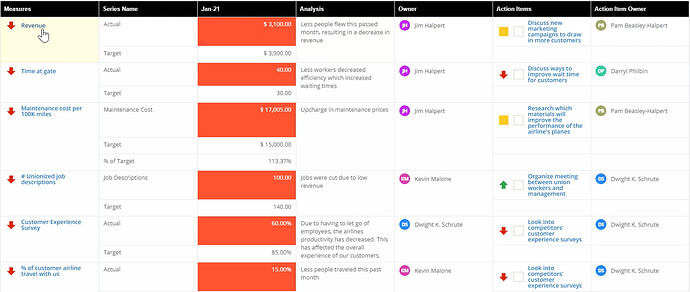
Enhanced data table, Flexmonster and many more are few examples.Below image would be one such example.Basic table like lens and discover don't satisfy modern customer data visulization needs.(Link downloads,button api calls,image integration,pivoting..many more could be looked into)
Powerful search engine limited by basic visualization was feedback, usual ans was- this aint meant for this purpose.
Thanks

