Hi,
I'd like to create a Visualisation for our Sales team, to easily show what the top 3 sold items are.
I have come across a strange behaviour when using a simple Visualisation where I would like to count the top 3 Terms from all the documents in my index. Doesn't matter which Visualisation I choose, its always the same result.
My index has 999 documents, so I leave the Y-Axis aggregation as: "Count"
-> The result shows correctly 999 results
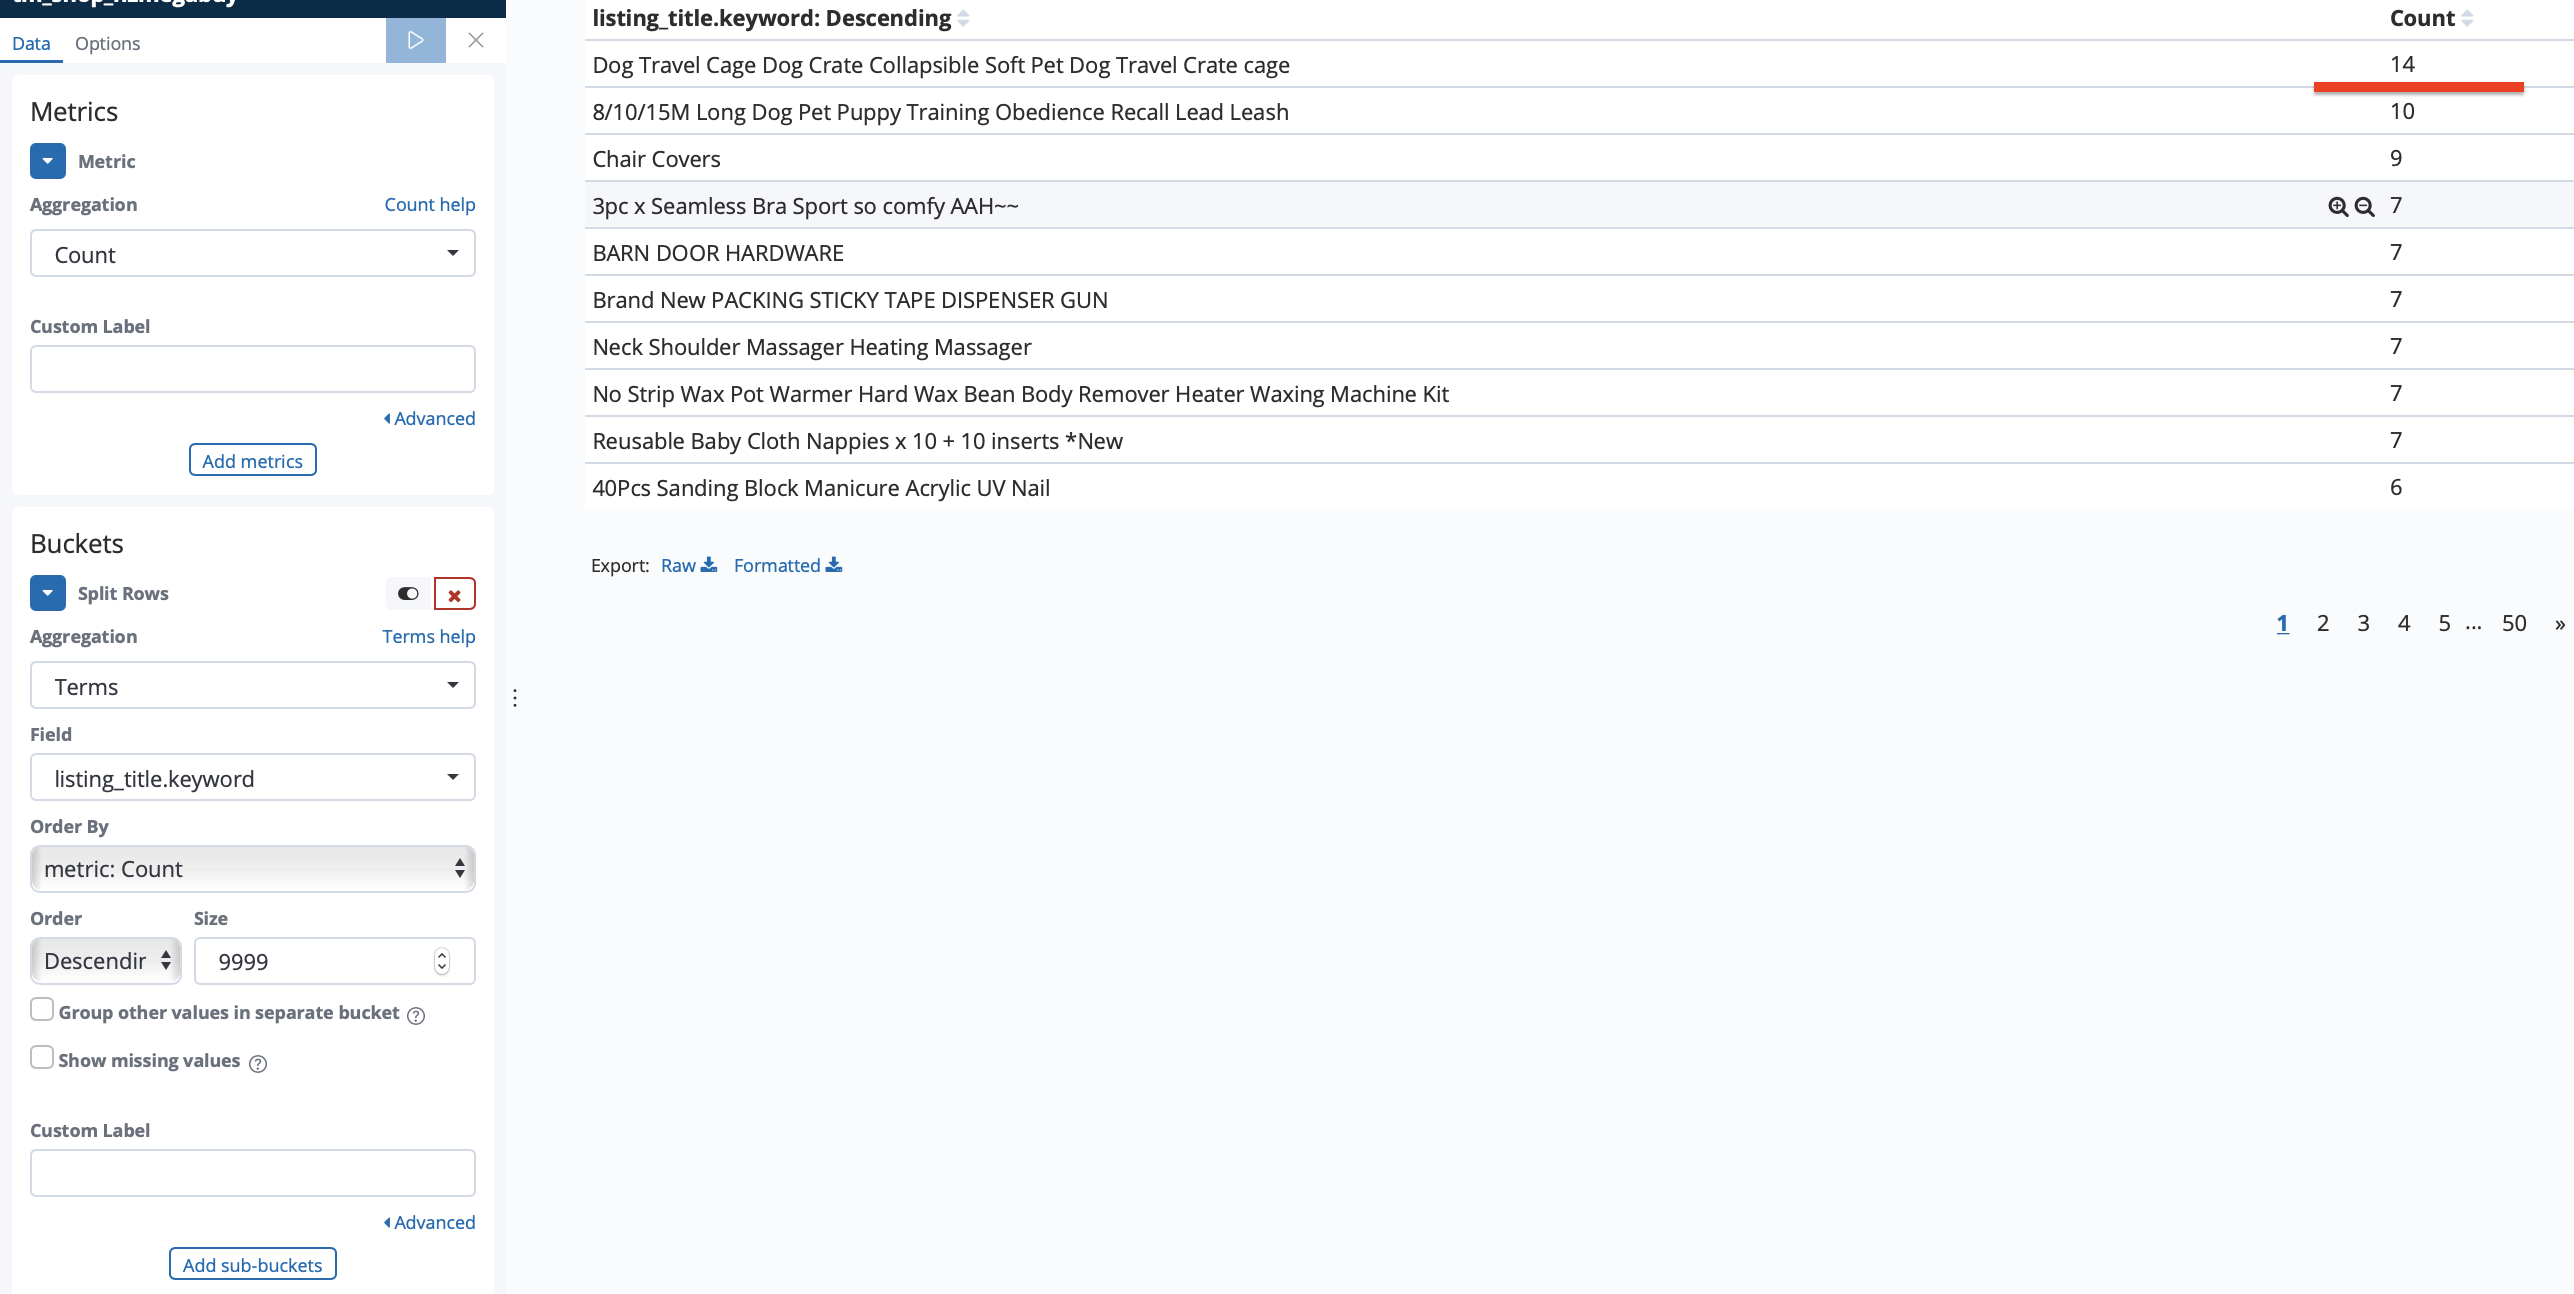
I then create a Bucket with an Aggregation of "Terms" and pick the Field "Listing Title" and select "Descending, Size: 3"
-> The result shows the 3 Items but the Aggregated number is incorrect. Its shows 12 instead of 14.
I checked the source CSV and the Top sold items appears indeed 14 times. There are no typos/whitespaces which could mess with the Visualisation.
When I change the Bucket settings from: "Descending, Size: 3" to: "Descending, Size: 9999", I get the correct Amount of 14 displayed. But then I also get all the other Items we are not interested in, displayed.
Am I missing something here or is this an intended behaviour? I have also played around wth other Bucket types/Aggregations, but I never get the result that I'd like. Any ideas what I might be doing wrong here?