I have been currently exploring Kibana visualizations of some test data, specifically horizontal bar charts. I had been attempting to bucket the x-axis by aggregation of terms when I was surprised to notice that, when using count as the ordering metric, manipulating the depth of the descending ordering caused the actual values of the counts results to change!
Specifically, I was looking at the top 10 fields in descending order, and their ordering was different depending on whether I had the order size set at 10 or 50. Furthermore, the total counts when hovering over the individual field results didn't always agree with the results of the count of a naive query on the field from the dataset in the "Discover" tab.
Specifically, when I queried the specific index for the specific "top" field, the count that was returned matched the count returned when I windowed the visualization ordering size to 50, but not to the resulting count of the same field when the ordering size was windowed to 10; there, the count was a full 20 items less!
Has anyone else experienced unstable sorting, or is there any explanation as to why changing the size of the ordering has an impact on the results returned?
Thank you for reaching out. I have only installed Elasticsearch and Kibana on a single machine, so I don't think that I'm running into any eventual consistency or accuracy issues related to Elasticsearch's distributed architecture, but I could be wrong.
Another factor here is that the data provided from all these logs is a couple weeks in the past and is no longer changing. Here's some screen shots:
This first screen shot shows a visualization of the top 50 most common values found in the vendor_id term. You can see that according to the visualization, the vendor_id "1060" appears most often, with a count of 135.
In this picture, you can see I'm querying the index directly to try to see which logs have a vendor_id term equal to the value "1060". Again, this search yields 135 hits.
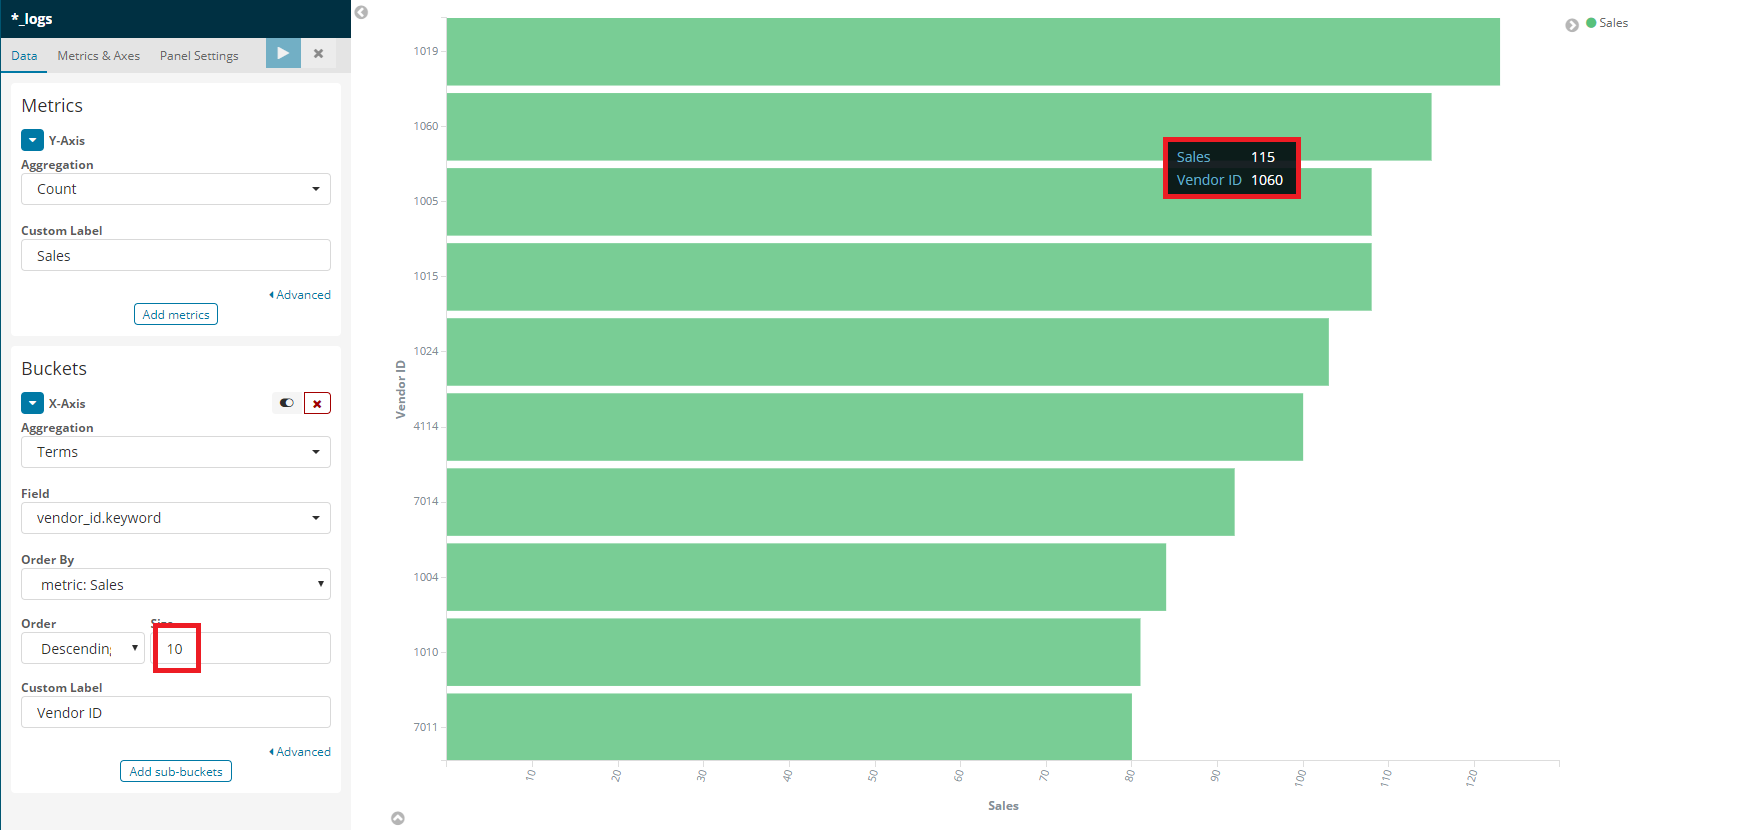
Here you can see a visualization on the same index with the all the same parameters, barring one; the size of the terms to order by. When hovering over the bucketed term corresponding to "1060" there, it reports a count of only "115"! I'm confused where the missing 20 counts went.
This behavior isn't only limited to this specific vendor_id term, "1060" or just for these two size values. The list is ordered differently yet again for 25 terms. See below:
Wow. Interesting. Thanks for that tip and I apologize - it appears had I read your initial documentation a little bit closer, I might have expected this. Is there any chance that the 6.1 or later versions of the documentation have a page for "Approximate Aggregations", like the 2.x version of the documentation does? If so, is it possible to tag or link aggregations that are approximate with such a page, or group them together? Or are all bucket aggregations by their nature approximate and I clearly just missed this?
For those who come after me, to make it clear: It appears that term aggregation is an operation that Elasticsearch approximates in order to improve latency. It appears there is indeed a positive impact from increasing the shard size with regards to search accuracy (assuming you can trade off the compute cost).
One of the things I'm still a little confused about is by how much the shard size affects results. By default, according to the documentation, Elasticsearch indices are only created with five shards. Yet I observed that when viewing the top 50 aggregations of the vendor_id term, the results did not stabilize until the shard_size value in the advanced JSON field was around 400 or so. I would have assumed, given that detail, that the values would be completely stable at { "shard_size" = 5 } and beyond...
Thank you for being so patient and pointing me right to the documentation line. That makes absolutely perfect sense.
I'm accepting your suggestion to increase the shard_size as the answer to my issue. I'm also "liking" your comment regarding the meaning of shard_size. You have been very kind and helpful to a newcomer like myself.
Apache, Apache Lucene, Apache Hadoop, Hadoop, HDFS and the yellow elephant
logo are trademarks of the
Apache Software Foundation
in the United States and/or other countries.