I want to know the reason why kibana is way too slow. when i refresh the dashboard and canvas.
I run kibana on 2 cpu core and 4Gi memory pod.
I didn't use any custom plugins.
what could be the problem?
I don't see any errors there?
What do your Kibana and Elasticsearch logs show?
Do you have Monitoring enabled?
my kibana version is 7.9.3.
and run with docker image 'docker.elastic.co/kibana/kibana:7.9.3'
i guess elasticserach has no error logs. (docker logs ~)
and monitoring is disabled. should i have to enable the monitoring ?
A slow Kibana is potentially from a slow Elasticsearch, so monitoring would show you what is happening.
Yes that's it.
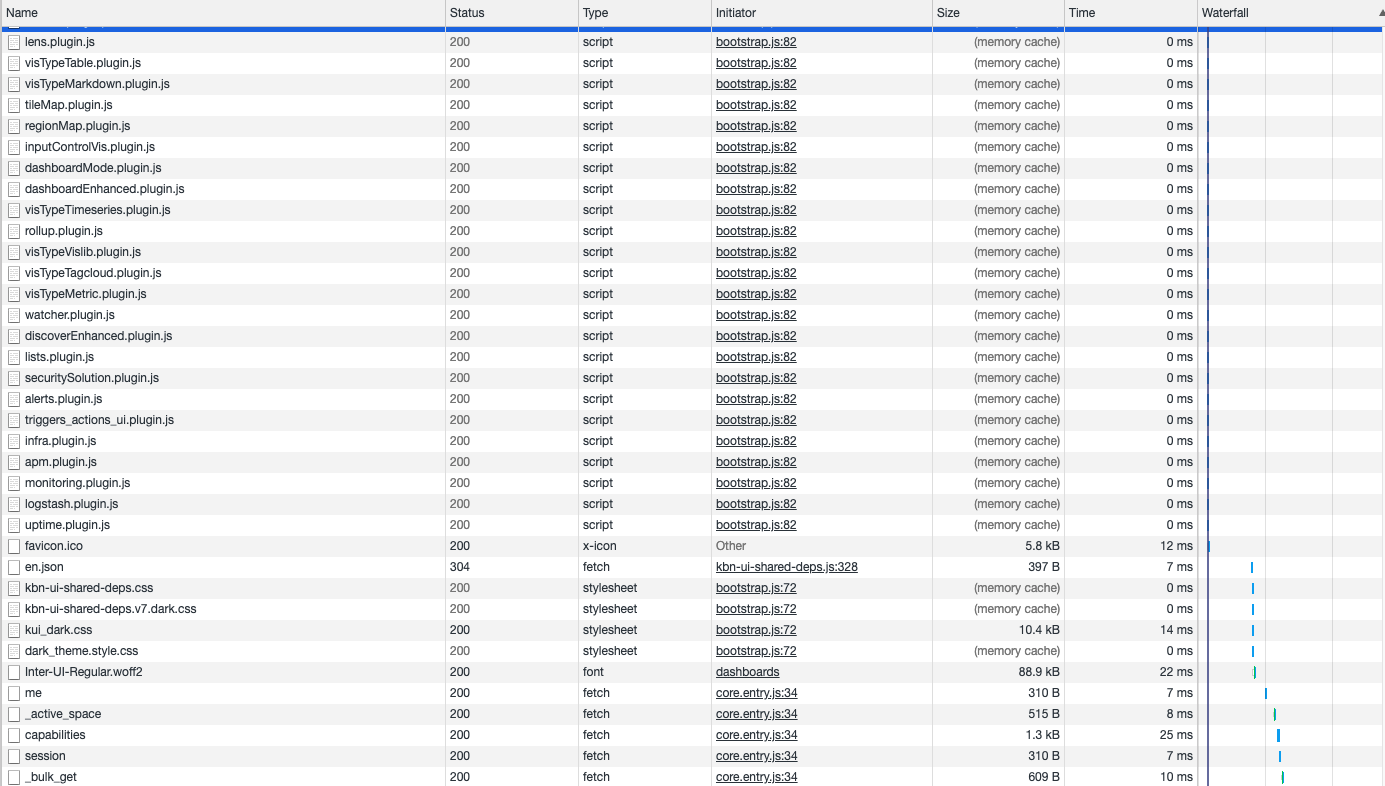
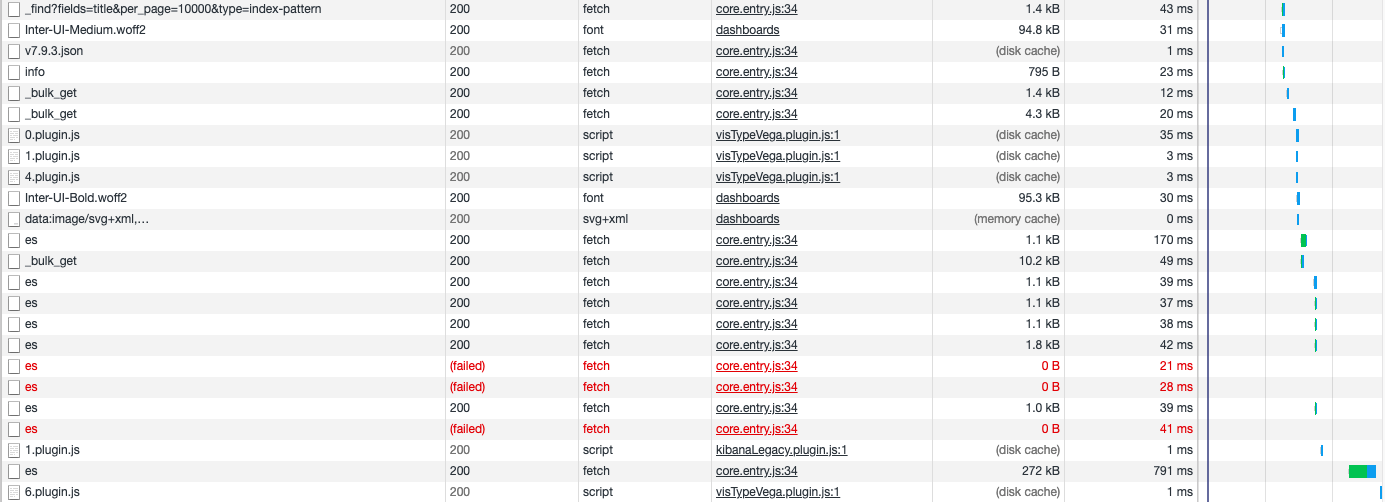
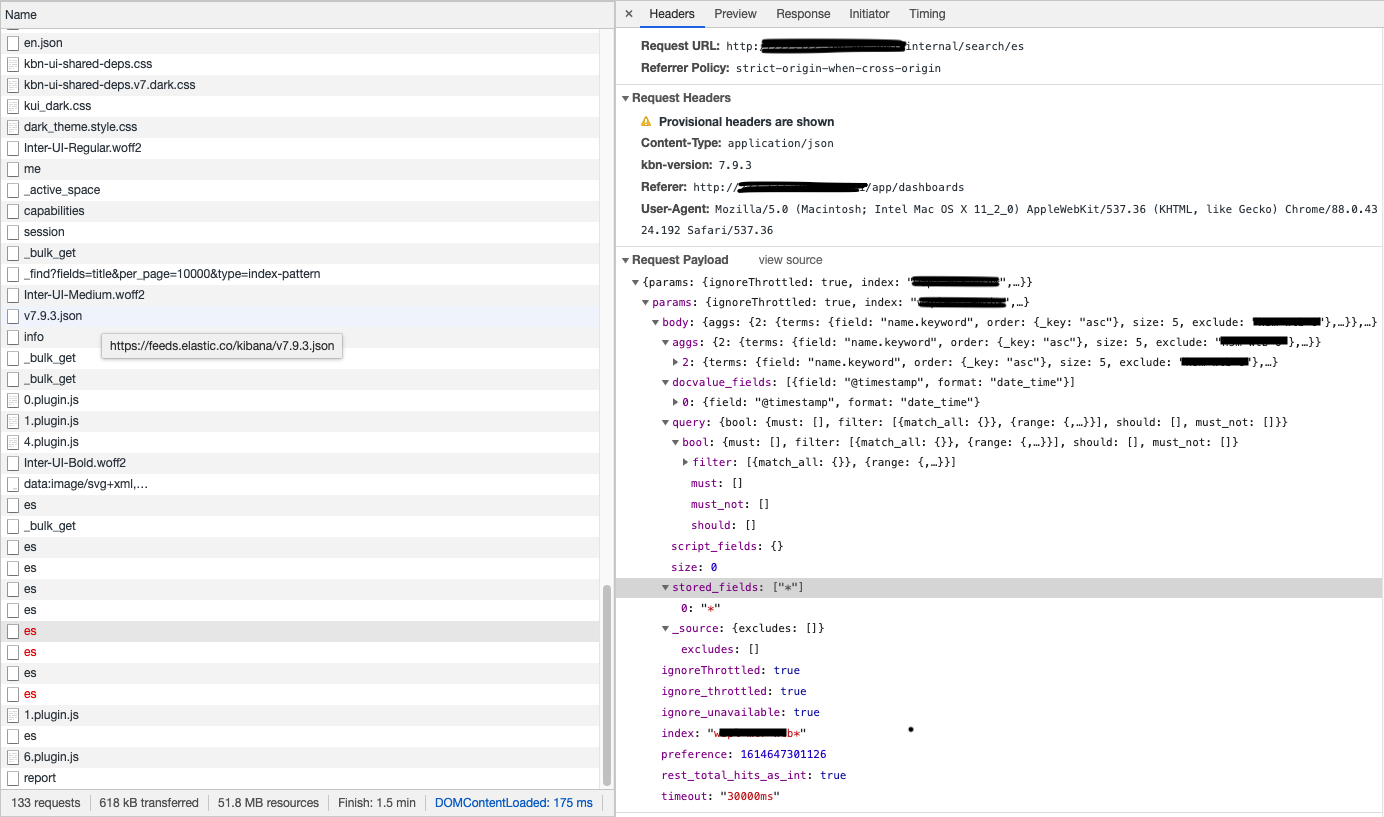
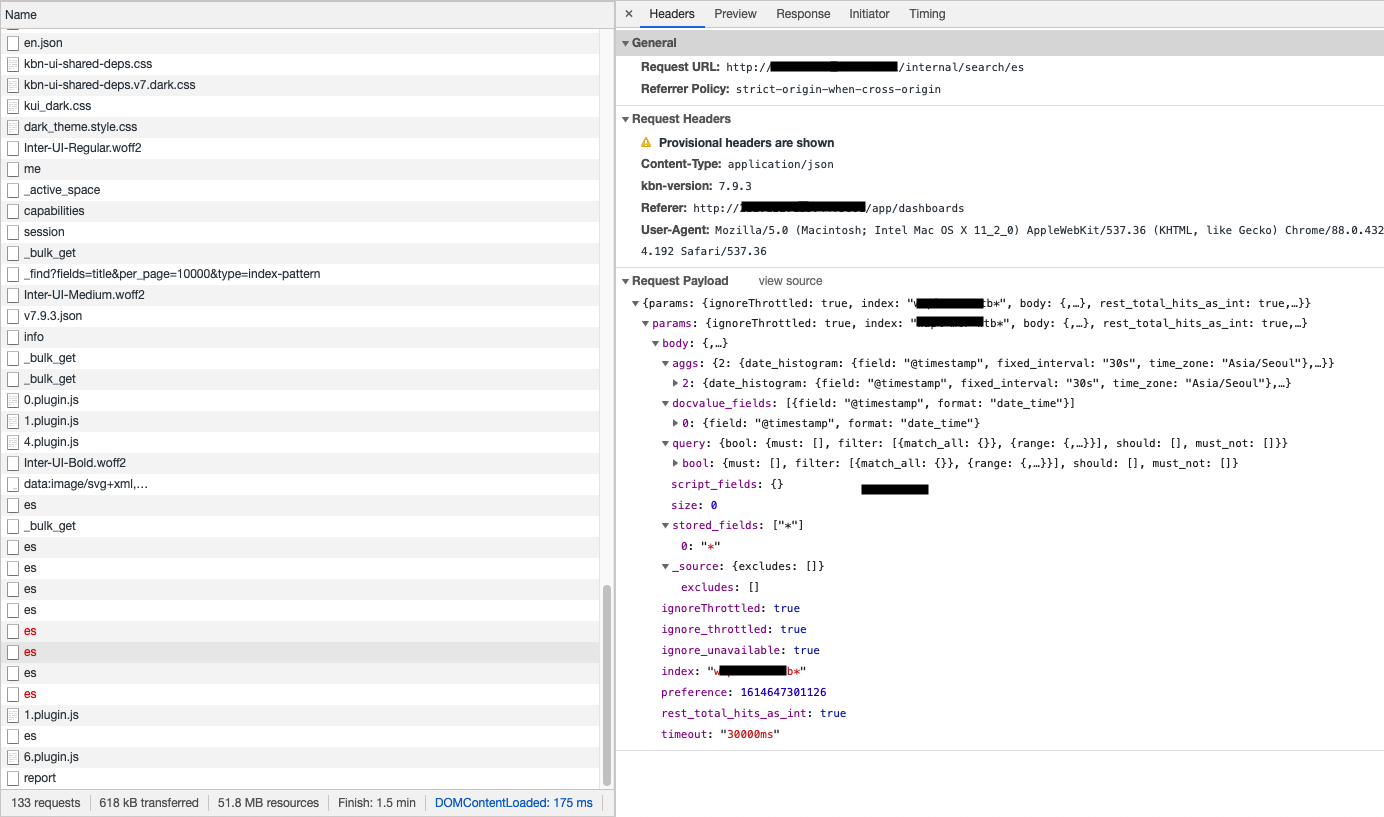
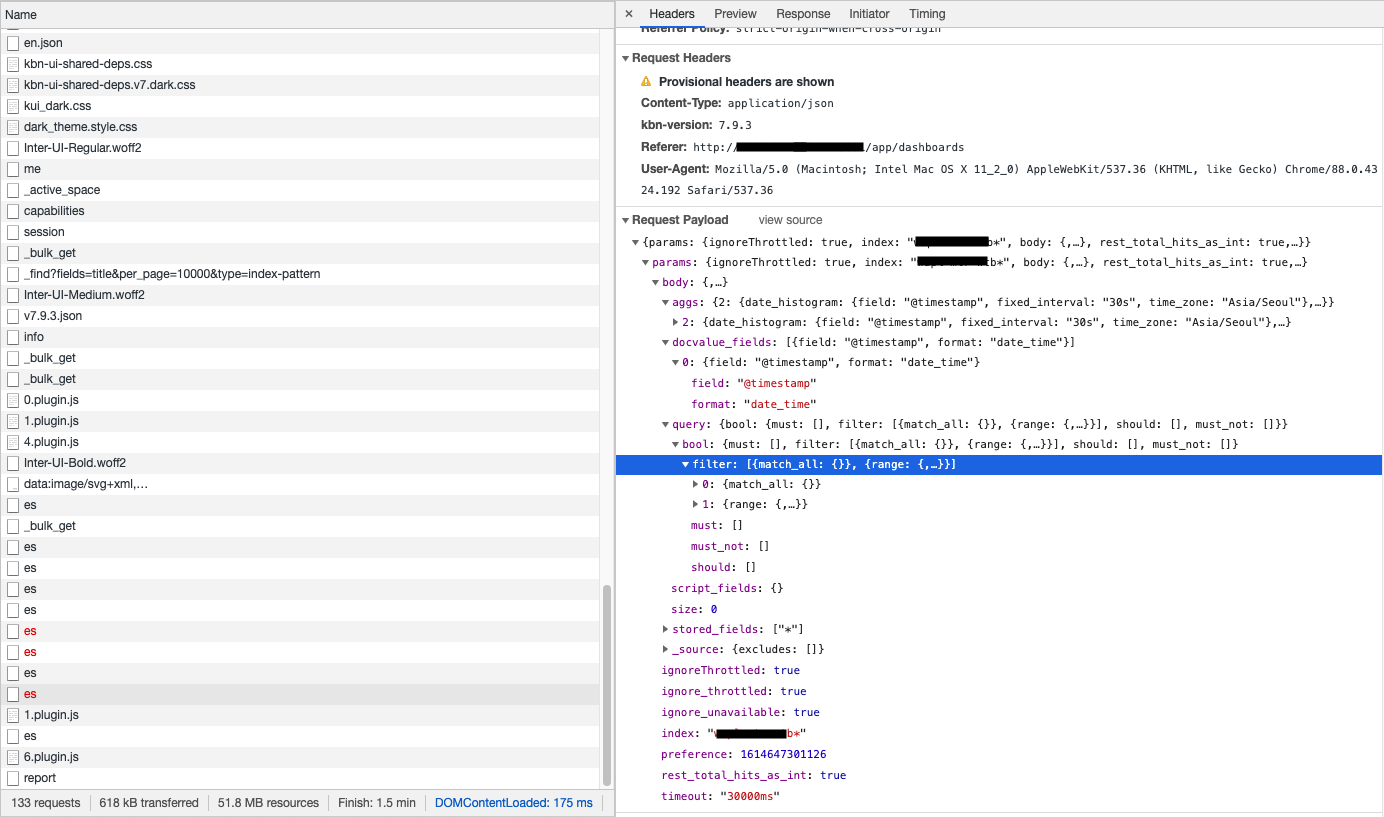
What do things show when you see slowness in Kibana?
What does the error say? What do the Kibana logs show?
© 2020. All Rights Reserved - Elasticsearch
Apache, Apache Lucene, Apache Hadoop, Hadoop, HDFS and the yellow elephant logo are trademarks of the Apache Software Foundation in the United States and/or other countries.