From my previous post, i was able to enable Kibana dashboards for kubernetes monitoring with elatic agent. Agent is installed via manifest provided by elastic, just changed node_name to node_ip and changed namespace prefix pointing from elastic to kube_stats.
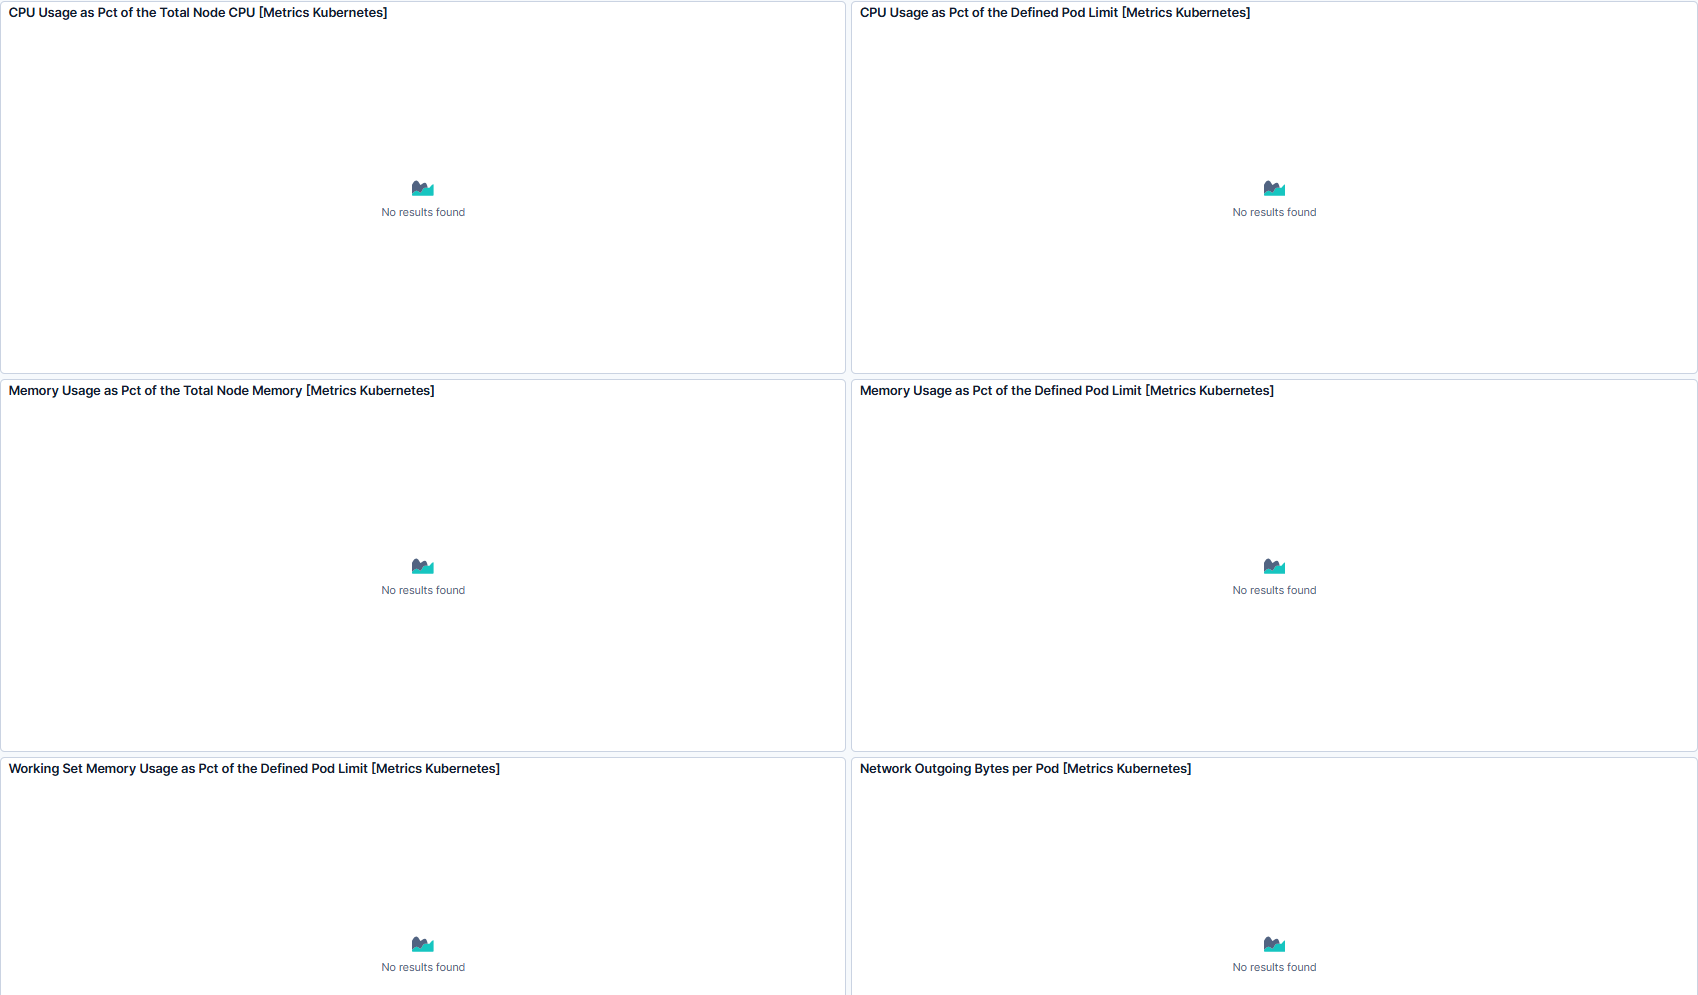
Unfortunately, Kubernetes overview dashboard show overall info, but not CPU/RAM usage of pods. From where are those metrics collected, and what could be the cause? Or what should i check? Thank you
Maybe we need to verify => Collect Kubernetes metrics from Kubelet API , verify if the Hosts entry is correct.
In the metrics index see check if the below field is populated as it is used in lens => Top CPU intensive pods per Node
kubernetes.pod.cpu.usage.node.pct
Apache, Apache Lucene, Apache Hadoop, Hadoop, HDFS and the yellow elephant
logo are trademarks of the
Apache Software Foundation
in the United States and/or other countries.