Kibana launch failed

I deploy elasticsearch on 192.168.50.216 and 192.168.50.69. Both are working.

[epi@localhost ~]$ curl 192.168.50.69:9200
{
  "name" : "EpCent-1",
  "cluster_name" : "EpCluster",
  "cluster_uuid" : "XuZIcIMhR46iStO7LJIdNw",
  "version" : {
    "number" : "7.13.2",
    "build_flavor" : "default",
    "build_type" : "tar",
    "build_hash" : "4d960a0733be83dd2543ca018aa4ddc42e956800",
    "build_date" : "2021-06-10T21:01:55.251515791Z",
    "build_snapshot" : false,
    "lucene_version" : "8.8.2",
    "minimum_wire_compatibility_version" : "6.8.0",
    "minimum_index_compatibility_version" : "6.0.0-beta1"
  },
  "tagline" : "You Know, for Search"
}
[epi@localhost ~]$ curl 192.168.50.216:9200
{
  "name" : "EpCent-0",
  "cluster_name" : "EpCluster",
  "cluster_uuid" : "XuZIcIMhR46iStO7LJIdNw",
  "version" : {
    "number" : "7.13.2",
    "build_flavor" : "default",
    "build_type" : "tar",
    "build_hash" : "4d960a0733be83dd2543ca018aa4ddc42e956800",
    "build_date" : "2021-06-10T21:01:55.251515791Z",
    "build_snapshot" : false,
    "lucene_version" : "8.8.2",
    "minimum_wire_compatibility_version" : "6.8.0",
    "minimum_index_compatibility_version" : "6.0.0-beta1"
  },
  "tagline" : "You Know, for Search"
}
[epi@localhost ~]$

Now, I want to deploy kibana on 192.168.50.216 and the kibana.yml is:

server.port: 5602
server.host: "0.0.0.0"
elasticsearch.hosts: ["http://192.168.50.216:9200", "http://192.168.50.69:9200"]

When I start the kibana, it exit with 1.

Full log:

[epi@localhost kibana-7.13.2-linux-x86_64]$ ./bin/kibana
  log   [17:11:17.634] [info][plugins-service] Plugin "timelines" is disabled.
  log   [17:11:17.774] [warning][config][deprecation] plugins.scanDirs is deprecated and is no longer used
  log   [17:11:17.774] [warning][config][deprecation] Config key [monitoring.cluster_alerts.email_notifications.email_address] will be required for email notifications to work in 8.0."
  log   [17:11:18.045] [info][plugins-system] Setting up [106] plugins: [taskManager,licensing,globalSearch,globalSearchProviders,banners,code,usageCollection,xpackLegacy,telemetryCollectionManager,telemetry,telemetryCollectionXpack,kibanaUsageCollection,securityOss,share,newsfeed,mapsEms,mapsLegacy,kibanaLegacy,translations,licenseApiGuard,legacyExport,embeddable,uiActionsEnhanced,expressions,charts,esUiShared,bfetch,data,home,console,consoleExtensions,apmOss,searchprofiler,painlessLab,grokdebugger,management,advancedSettings,savedObjects,visualizations,visTypeTable,visTypeMarkdown,visTypeMetric,visTypeVislib,visTypeVega,visTypeTimelion,features,licenseManagement,watcher,visTypeTagcloud,visTypeXy,tileMap,regionMap,presentationUtil,canvas,graph,timelion,dashboard,dashboardEnhanced,visualize,visTypeTimeseries,inputControlVis,indexPatternManagement,discover,discoverEnhanced,savedObjectsManagement,spaces,security,savedObjectsTagging,lens,reporting,lists,encryptedSavedObjects,dataEnhanced,dashboardMode,cloud,upgradeAssistant,snapshotRestore,fleet,indexManagement,rollup,remoteClusters,crossClusterReplication,indexLifecycleManagement,enterpriseSearch,beatsManagement,transform,ingestPipelines,fileUpload,maps,fileDataVisualizer,eventLog,actions,alerting,triggersActionsUi,stackAlerts,ruleRegistry,observability,osquery,ml,securitySolution,cases,infra,monitoring,logstash,apm,uptime]
  log   [17:11:18.047] [info][plugins][taskManager] TaskManager is identified by the Kibana UUID: 4c9eed9e-33c3-48c0-8260-c6f3d73c6503
  log   [17:11:18.322] [warning][config][plugins][security] Generating a random key for xpack.security.encryptionKey. To prevent sessions from being invalidated on restart, please set xpack.security.encryptionKey in the kibana.yml or use the bin/kibana-encryption-keys command.
  log   [17:11:18.322] [warning][config][plugins][security] Session cookies will be transmitted over insecure connections. This is not recommended.
  log   [17:11:18.374] [warning][config][plugins][reporting] Generating a random key for xpack.reporting.encryptionKey. To prevent sessions from being invalidated on restart, please set xpack.reporting.encryptionKey in the kibana.yml or use the bin/kibana-encryption-keys command.
  log   [17:11:18.382] [warning][config][plugins][reporting] Chromium sandbox provides an additional layer of protection, but is not supported for Linux CentOS 7.9.2009 OS. Automatically setting 'xpack.reporting.capture.browser.chromium.disableSandbox: true'.
  log   [17:11:18.383] [warning][encryptedSavedObjects][plugins] Saved objects encryption key is not set. This will severely limit Kibana functionality. Please set xpack.encryptedSavedObjects.encryptionKey in the kibana.yml or use the bin/kibana-encryption-keys command.
  log   [17:11:18.514] [warning][actions][actions][plugins] APIs are disabled because the Encrypted Saved Objects plugin is missing encryption key. Please set xpack.encryptedSavedObjects.encryptionKey in the kibana.yml or use the bin/kibana-encryption-keys command.
  log   [17:11:18.529] [warning][alerting][alerting][plugins][plugins] APIs are disabled because the Encrypted Saved Objects plugin is missing encryption key. Please set xpack.encryptedSavedObjects.encryptionKey in the kibana.yml or use the bin/kibana-encryption-keys command.
  log   [17:11:18.617] [info][monitoring][monitoring][plugins] config sourced from: production cluster
  log   [17:11:18.922] [info][savedobjects-service] Waiting until all Elasticsearch nodes are compatible with Kibana before starting saved objects migrations...
  log   [17:11:18.997] [info][savedobjects-service] Starting saved objects migrations
  log   [17:11:19.043] [info][savedobjects-service] [.kibana_task_manager] INIT -> OUTDATED_DOCUMENTS_SEARCH. took: 7ms.
  log   [17:11:19.056] [info][savedobjects-service] [.kibana] INIT -> OUTDATED_DOCUMENTS_SEARCH. took: 22ms.
  log   [17:11:19.070] [info][savedobjects-service] [.kibana] OUTDATED_DOCUMENTS_SEARCH -> UPDATE_TARGET_MAPPINGS. took: 14ms.
  log   [17:11:19.075] [info][savedobjects-service] [.kibana_task_manager] OUTDATED_DOCUMENTS_SEARCH -> UPDATE_TARGET_MAPPINGS. took: 32ms.
  log   [17:11:19.097] [info][savedobjects-service] [.kibana_task_manager] UPDATE_TARGET_MAPPINGS -> UPDATE_TARGET_MAPPINGS_WAIT_FOR_TASK. took: 22ms.
  log   [17:11:19.102] [error][savedobjects-service] [.kibana_task_manager] [resource_not_found_exception]: task [9EbhpvJ2QYCSY_F_ALmGAw:11431] isn't running and hasn't stored its results
  log   [17:11:19.103] [error][savedobjects-service] [.kibana_task_manager] migration failed, dumping execution log:
  log   [17:11:19.103] [info][savedobjects-service] [.kibana_task_manager] INIT RESPONSE
  log   [17:11:19.104] [info][savedobjects-service] [.kibana_task_manager] INIT -> OUTDATED_DOCUMENTS_SEARCH
  log   [17:11:19.106] [info][savedobjects-service] [.kibana_task_manager] OUTDATED_DOCUMENTS_SEARCH RESPONSE
  log   [17:11:19.106] [info][savedobjects-service] [.kibana_task_manager] OUTDATED_DOCUMENTS_SEARCH -> UPDATE_TARGET_MAPPINGS
  log   [17:11:19.107] [info][savedobjects-service] [.kibana_task_manager] UPDATE_TARGET_MAPPINGS RESPONSE
  log   [17:11:19.108] [info][savedobjects-service] [.kibana_task_manager] UPDATE_TARGET_MAPPINGS -> UPDATE_TARGET_MAPPINGS_WAIT_FOR_TASK
  log   [17:11:19.109] [fatal][root] Error: Unable to complete saved object migrations for the [.kibana_task_manager] index. Please check the health of your Elasticsearch cluster and try again. Error: [resource_not_found_exception]: task [9EbhpvJ2QYCSY_F_ALmGAw:11431] isn't running and hasn't stored its results
    at migrationStateActionMachine (/home/epi/kibana-7.13.2-linux-x86_64/src/core/server/saved_objects/migrationsv2/migrations_state_action_machine.js:156:13)
    at processTicksAndRejections (internal/process/task_queues.js:93:5)
    at async Promise.all (index 1)
    at SavedObjectsService.start (/home/epi/kibana-7.13.2-linux-x86_64/src/core/server/saved_objects/saved_objects_service.js:163:7)
    at Server.start (/home/epi/kibana-7.13.2-linux-x86_64/src/core/server/server.js:275:31)
    at Root.start (/home/epi/kibana-7.13.2-linux-x86_64/src/core/server/root/index.js:55:14)
    at bootstrap (/home/epi/kibana-7.13.2-linux-x86_64/src/core/server/bootstrap.js:98:5)
    at Command.<anonymous> (/home/epi/kibana-7.13.2-linux-x86_64/src/cli/serve/serve.js:224:5)
  log   [17:11:19.115] [info][plugins-system] Stopping all plugins.
  log   [17:11:19.116] [info][kibana-monitoring][monitoring][monitoring][plugins] Monitoring stats collection is stopped
  log   [17:11:19.142] [info][savedobjects-service] [.kibana] UPDATE_TARGET_MAPPINGS -> UPDATE_TARGET_MAPPINGS_WAIT_FOR_TASK. took: 72ms.
  log   [17:11:19.145] [error][savedobjects-service] [.kibana] [resource_not_found_exception]: task [9EbhpvJ2QYCSY_F_ALmGAw:11437] isn't running and hasn't stored its results
  log   [17:11:19.145] [error][savedobjects-service] [.kibana] migration failed, dumping execution log:
  log   [17:11:19.145] [info][savedobjects-service] [.kibana] INIT RESPONSE
  log   [17:11:19.150] [info][savedobjects-service] [.kibana] INIT -> OUTDATED_DOCUMENTS_SEARCH
  log   [17:11:19.153] [info][savedobjects-service] [.kibana] OUTDATED_DOCUMENTS_SEARCH RESPONSE
  log   [17:11:19.153] [info][savedobjects-service] [.kibana] OUTDATED_DOCUMENTS_SEARCH -> UPDATE_TARGET_MAPPINGS
  log   [17:11:19.155] [info][savedobjects-service] [.kibana] UPDATE_TARGET_MAPPINGS RESPONSE
  log   [17:11:19.156] [info][savedobjects-service] [.kibana] UPDATE_TARGET_MAPPINGS -> UPDATE_TARGET_MAPPINGS_WAIT_FOR_TASK
  log   [17:11:49.121] [warning][plugins-system] "eventLog" plugin didn't stop in 30sec., move on to the next.

 FATAL  Error: Unable to complete saved object migrations for the [.kibana_task_manager] index. Please check the health of your Elasticsearch cluster and try again. Error: [resource_not_found_exception]: task [9EbhpvJ2QYCSY_F_ALmGAw:11431] isn't running and hasn't stored its results

[epi@localhost kibana-7.13.2-linux-x86_64]$

Is there something wrong with kibana.yml? I try with elasticsearch.hosts: ["http://192.168.50.216:9200"], kibana could start.

I mean, if I only specific one elasticsearch.host, kibana cloud start.
Hi @EpLiar ,

welcome to the Kibana community.
Could you check the ES logs? Maybe we could get some more information.

From your logs it seems the saved object migration failed on one of the nodes:

log   [17:11:19.109] [fatal][root] Error: Unable to complete saved object migrations for the [.kibana_task_manager] index. Please check the health of your Elasticsearch cluster and try again. Error: [resource_not_found_exception]: task [9EbhpvJ2QYCSY_F_ALmGAw:11431] isn't running and hasn't stored its results

Hi Marco_Liberati:

Thank you for your reply.

I ran Kibana on my office computer, and now it's the weekend and I need to try to reproduce it on my home computer.

If this happens again, I will reply to this topic again.

Hi Marco_Liberati:

I create a local virtual machine on my PC and run kibana, it fails to start again.

  log   [22:22:08.862] [info][monitoring][monitoring][plugins] config sourced from: production cluster
  log   [22:22:09.036] [info][savedobjects-service] Waiting until all Elasticsearch nodes are compatible with Kibana before starting saved objects migrations...
  log   [22:22:09.093] [info][savedobjects-service] Starting saved objects migrations
  log   [22:22:38.942] [error][savedobjects-service] [.kibana_task_manager] Action failed with 'master_not_discovered_exception'. Retrying attempt 1 in 2 seconds.
  log   [22:22:38.942] [info][savedobjects-service] [.kibana_task_manager] INIT -> INIT. took: 29822ms.
  log   [22:22:39.129] [error][savedobjects-service] [.kibana] Action failed with 'Request timed out'. Retrying attempt 1 in 2 seconds.
  log   [22:22:39.129] [info][savedobjects-service] [.kibana] INIT -> INIT. took: 30010ms.
  log   [22:23:10.947] [error][savedobjects-service] [.kibana_task_manager] Action failed with 'Request timed out'. Retrying attempt 2 in 4 seconds.
  log   [22:23:10.948] [info][savedobjects-service] [.kibana_task_manager] INIT -> INIT. took: 32005ms.
  log   [22:23:11.137] [error][savedobjects-service] [.kibana] Action failed with 'Request timed out'. Retrying attempt 2 in 4 seconds.
  log   [22:23:11.137] [info][savedobjects-service] [.kibana] INIT -> INIT. took: 32008ms.
  log   [22:23:44.954] [error][savedobjects-service] [.kibana_task_manager] Action failed with 'Request timed out'. Retrying attempt 3 in 8 seconds.
  log   [22:23:44.954] [info][savedobjects-service] [.kibana_task_manager] INIT -> INIT. took: 34007ms.
  log   [22:23:45.142] [error][savedobjects-service] [.kibana] Action failed with 'Request timed out'. Retrying attempt 3 in 8 seconds.
  log   [22:23:45.143] [info][savedobjects-service] [.kibana] INIT -> INIT. took: 34005ms.

From this log it seems that ES is is unable to elect a master.

  log   [22:22:38.942] [error][savedobjects-service] [.kibana_task_manager] Action failed with 'master_not_discovered_exception'. Retrying attempt 1 in 2 seconds.

Can you share the ES configuration?
For instance the value of discovery.seed_hosts is important in this case.

The EpNodeMaster's ES config:

cluster.name: EpCluster
node.name: EpNodeMaster
network.host: 0.0.0.0
http.port: 9200
discovery.seed_hosts: ["192.168.50.52", "192.168.50.78"]

The EpNodeSlave's ES config:

cluster.name: EpCluster
node.name: EpNodeSlave
network.host: 0.0.0.0
http.port: 9200
discovery.seed_hosts: ["192.168.50.52", "192.168.50.78"]

The IP of EpNodeMaster is 192.168.50.52.
The IP of EpNodeSlave is 192.168.50.78.

The current Kibana's config file is

server.port: 5601
server.host: 0.0.0.0
elasticsearch.hosts: ["http://192.168.50.52:9200", "http://192.168.50.78:9200"]

I add this config in both two ES config, now Kibana started.

cluster.initial_master_nodes: ["EpNodeMaster"]

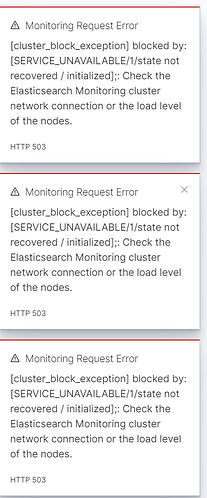
But there is a new error on Kibana.

How much free space do you have on disk?

[epi@bogon ~]$ df -mh
devtmpfs                 5.0G     0  5.0G    0% /dev
tmpfs                    5.0G     0  5.0G    0% /dev/shm
tmpfs                    5.0G  8.5M  5.0G    1% /run
tmpfs                    5.0G     0  5.0G    0% /sys/fs/cgroup
/dev/mapper/centos-root  9.6G  2.5G  7.2G   26% /
/dev/sda2               1014M  186M  829M   19% /boot
/dev/sda1                200M   12M  189M    6% /boot/efi
tmpfs                   1008M     0 1008M    0% /run/user/1000

Does it need more hard drive space? If so, I will create a new VM with the bigger disk.

Can you post the ES logs? Maybe we can find some more insights in there about the errors.

I start the Kibana and this is the log:

.....something ignores due to regulation....
  log   [23:59:28.432] [warning][config][plugins][security] Session cookies will be transmitted over insecure connections. This is not recommended.
  log   [23:59:28.464] [warning][config][plugins][reporting] Generating a random key for xpack.reporting.encryptionKey. To prevent sessions from being invalidated on restart, please set xpack.reporting.encryptionKey in the kibana.yml or use the bin/kibana-encryption-keys command.
  log   [23:59:28.469] [warning][config][plugins][reporting] Chromium sandbox provides an additional layer of protection, but is not supported for Linux CentOS 7.9.2009 OS. Automatically setting 'xpack.reporting.capture.browser.chromium.disableSandbox: true'.
  log   [23:59:28.470] [warning][encryptedSavedObjects][plugins] Saved objects encryption key is not set. This will severely limit Kibana functionality. Please set xpack.encryptedSavedObjects.encryptionKey in the kibana.yml or use the bin/kibana-encryption-keys command.
  log   [23:59:28.547] [warning][actions][actions][plugins] APIs are disabled because the Encrypted Saved Objects plugin is missing encryption key. Please set xpack.encryptedSavedObjects.encryptionKey in the kibana.yml or use the bin/kibana-encryption-keys command.
  log   [23:59:28.557] [warning][alerting][alerting][plugins][plugins] APIs are disabled because the Encrypted Saved Objects plugin is missing encryption key. Please set xpack.encryptedSavedObjects.encryptionKey in the kibana.yml or use the bin/kibana-encryption-keys command.
  log   [23:59:28.609] [info][monitoring][monitoring][plugins] config sourced from: production cluster
  log   [23:59:28.781] [info][savedobjects-service] Waiting until all Elasticsearch nodes are compatible with Kibana before starting saved objects migrations...
  log   [23:59:28.834] [info][savedobjects-service] Starting saved objects migrations
  log   [23:59:28.869] [error][savedobjects-service] [.kibana] Action failed with 'connect EHOSTUNREACH 192.168.50.78:9200'. Retrying attempt 1 in 2 seconds.
  log   [23:59:28.870] [info][savedobjects-service] [.kibana] INIT -> INIT. took: 8ms.
  log   [23:59:28.872] [info][savedobjects-service] [.kibana_task_manager] INIT -> OUTDATED_DOCUMENTS_SEARCH. took: 10ms.
  log   [23:59:28.880] [info][savedobjects-service] [.kibana_task_manager] OUTDATED_DOCUMENTS_SEARCH -> UPDATE_TARGET_MAPPINGS. took: 8ms.
  log   [23:59:28.903] [info][savedobjects-service] [.kibana_task_manager] UPDATE_TARGET_MAPPINGS -> UPDATE_TARGET_MAPPINGS_WAIT_FOR_TASK. took: 23ms.
  log   [23:59:29.011] [info][savedobjects-service] [.kibana_task_manager] UPDATE_TARGET_MAPPINGS_WAIT_FOR_TASK -> DONE. took: 108ms.
  log   [23:59:29.011] [info][savedobjects-service] [.kibana_task_manager] Migration completed after 149ms
  log   [23:59:30.882] [info][savedobjects-service] [.kibana] INIT -> OUTDATED_DOCUMENTS_SEARCH. took: 2011ms.
  log   [23:59:30.893] [info][savedobjects-service] [.kibana] OUTDATED_DOCUMENTS_SEARCH -> UPDATE_TARGET_MAPPINGS. took: 13ms.
  log   [23:59:30.982] [info][savedobjects-service] [.kibana] UPDATE_TARGET_MAPPINGS -> UPDATE_TARGET_MAPPINGS_WAIT_FOR_TASK. took: 89ms.
  log   [23:59:31.090] [info][savedobjects-service] [.kibana] UPDATE_TARGET_MAPPINGS_WAIT_FOR_TASK -> DONE. took: 108ms.
  log   [23:59:31.091] [info][savedobjects-service] [.kibana] Migration completed after 2230ms
  log   [23:59:31.117] [info][plugins-system] Starting [106] plugins: [taskManager,licensing,globalSearch,globalSearchProviders,banners,code,usageCollection,xpackLegacy,telemetryCollectionManager,telemetry,telemetryCollectionXpack,kibanaUsageCollection,securityOss,share,newsfeed,mapsEms,mapsLegacy,kibanaLegacy,translations,licenseApiGuard,legacyExport,embeddable,uiActionsEnhanced,expressions,charts,esUiShared,bfetch,data,home,console,consoleExtensions,apmOss,searchprofiler,painlessLab,grokdebugger,management,advancedSettings,savedObjects,visualizations,visTypeMetric,visTypeMarkdown,visTypeTable,visTypeVislib,visTypeVega,visTypeTimelion,features,licenseManagement,watcher,visTypeTagcloud,visTypeXy,tileMap,regionMap,presentationUtil,canvas,graph,timelion,dashboard,dashboardEnhanced,visualize,visTypeTimeseries,inputControlVis,indexPatternManagement,discover,discoverEnhanced,savedObjectsManagement,spaces,security,savedObjectsTagging,lens,reporting,lists,encryptedSavedObjects,dataEnhanced,dashboardMode,cloud,upgradeAssistant,snapshotRestore,fleet,indexManagement,rollup,remoteClusters,crossClusterReplication,indexLifecycleManagement,enterpriseSearch,beatsManagement,transform,ingestPipelines,fileUpload,maps,fileDataVisualizer,eventLog,actions,alerting,triggersActionsUi,stackAlerts,ruleRegistry,observability,osquery,ml,securitySolution,cases,infra,monitoring,logstash,apm,uptime]
  log   [23:59:33.370] [info][server][Kibana][http] http server running at http://0.0.0.0:5601
  log   [23:59:33.385] [error][elasticsearch] Request error, retrying
PUT http://192.168.50.78:9200/_template/.management-beats => connect EHOSTUNREACH 192.168.50.78:9200
  log   [23:59:33.386] [error][elasticsearch] Request error, retrying
GET http://192.168.50.78:9200/_xpack?accept_enterprise=true => connect EHOSTUNREACH 192.168.50.78:9200
  log   [23:59:33.438] [info][kibana-monitoring][monitoring][monitoring][plugins] Starting monitoring stats collection
  log   [23:59:33.503] [error][fleet][plugins] Setup for central management of agents failed.
  log   [23:59:33.504] [error][fleet][plugins] ConnectionError: connect EHOSTUNREACH 192.168.50.78:9200
    at ClientRequest.onError (/home/epi/kibana-7.13.2-linux-x86_64/node_modules/@elastic/elasticsearch/lib/Connection.js:115:16)
    at ClientRequest.emit (events.js:315:20)
    at Socket.socketErrorListener (_http_client.js:469:9)
    at Socket.emit (events.js:315:20)
    at emitErrorNT (internal/streams/destroy.js:106:8)
    at emitErrorCloseNT (internal/streams/destroy.js:74:3)
    at processTicksAndRejections (internal/process/task_queues.js:80:21) {
  meta: {
    body: null,
    statusCode: null,
    headers: null,
    meta: {
      context: null,
      request: [Object],
      name: 'elasticsearch-js',
      connection: [Object],
      attempts: 0,
      aborted: false
    }
  },
  isBoom: true,
  isServer: true,
  data: null,
  output: {
    statusCode: 503,
    payload: {
      statusCode: 503,
      error: 'Service Unavailable',
      message: 'connect EHOSTUNREACH 192.168.50.78:9200'
    },
    headers: {}
  },
  [Symbol(SavedObjectsClientErrorCode)]: 'SavedObjectsClient/esUnavailable'
}
  log   [23:59:33.517] [info][plugins][securitySolution] Dependent plugin setup complete - Starting ManifestTask
  log   [23:59:33.902] [info][plugins][reporting] Browser executable: /home/epi/kibana-7.13.2-linux-x86_64/x-pack/plugins/reporting/chromium/headless_shell-linux_x64/headless_shell
  log   [23:59:33.902] [warning][plugins][reporting] Enabling the Chromium sandbox provides an additional layer of protection.

The EpCluster.log on EpNodeMaster

[2021-07-02T23:58:42,693][INFO ][o.e.c.m.MetadataCreateIndexService] [EpNodeMaster] [.tasks] creating index, cause [auto(bulk api)], templates [], shards [1]/[1]
[2021-07-02T23:58:42,695][INFO ][o.e.c.r.a.AllocationService] [EpNodeMaster] updating number_of_replicas to [0] for indices [.tasks]
[2021-07-02T23:58:42,904][INFO ][o.e.c.r.a.AllocationService] [EpNodeMaster] Cluster health status changed from [YELLOW] to [GREEN] (reason: [shards started [[.tasks][0]]]).
[2021-07-02T23:58:42,970][INFO ][o.e.t.LoggingTaskListener] [EpNodeMaster] 229 finished with response BulkByScrollResponse[took=117.5ms,timed_out=false,sliceId=null,updated=10,created=0,deleted=0,batches=1,versionConflicts=0,noops=0,retries=0,throttledUntil=0s,bulk_failures=[],search_failures=[]]
[2021-07-02T23:58:44,767][INFO ][o.e.t.LoggingTaskListener] [EpNodeMaster] 262 finished with response BulkByScrollResponse[took=135.2ms,timed_out=false,sliceId=null,updated=13,created=0,deleted=0,batches=1,versionConflicts=0,noops=0,retries=0,throttledUntil=0s,bulk_failures=[],search_failures=[]]
[2021-07-02T23:59:28,970][INFO ][o.e.t.LoggingTaskListener] [EpNodeMaster] 578 finished with response 

The EpCluster.log on EpNodeSlave

[2021-07-02T23:58:49,987][WARN ][o.e.c.c.ClusterFormationFailureHelper] [EpNodeSlave] master not discovered yet, this node has not previously joined a bootstrapped (v7+) cluster, and this node must discover master-eligible nodes [EpNodeMaster] to bootstrap a cluster: have discovered [{EpNodeSlave}{Qc9NeP4gRNKhh_m05SHerw}{aN-GkdEcT6qeljI-nvvUeA}{192.168.50.78}{192.168.50.78:9300}{cdfhilmrstw}]; discovery will continue using [192.168.50.52:9300] from hosts providers and [{EpNodeSlave}{Qc9NeP4gRNKhh_m05SHerw}{aN-GkdEcT6qeljI-nvvUeA}{192.168.50.78}{192.168.50.78:9300}{cdfhilmrstw}] from last-known cluster state; node term 1, last-accepted version 0 in term 0
[2021-07-02T23:58:59,998][WARN ][o.e.c.c.ClusterFormationFailureHelper] [EpNodeSlave] master not discovered yet, this node has not previously joined a bootstrapped (v7+) cluster, and this node must discover master-eligible nodes [EpNodeMaster] to bootstrap a cluster: have discovered [{EpNodeSlave}{Qc9NeP4gRNKhh_m05SHerw}{aN-GkdEcT6qeljI-nvvUeA}{192.168.50.78}{192.168.50.78:9300}{cdfhilmrstw}]; discovery will continue using [192.168.50.52:9300] from hosts providers and [{EpNodeSlave}{Qc9NeP4gRNKhh_m05SHerw}{aN-GkdEcT6qeljI-nvvUeA}{192.168.50.78}{192.168.50.78:9300}{cdfhilmrstw}] from last-known cluster state; node term 1, last-accepted version 0 in term 0
[2021-07-02T23:59:10,024][WARN ][o.e.c.c.ClusterFormationFailureHelper] [EpNodeSlave] master not discovered yet, this node has not previously joined a bootstrapped (v7+) cluster, and this node must discover master-eligible nodes [EpNodeMaster] to bootstrap a cluster: have discovered [{EpNodeSlave}{Qc9NeP4gRNKhh_m05SHerw}{aN-GkdEcT6qeljI-nvvUeA}{192.168.50.78}{192.168.50.78:9300}{cdfhilmrstw}]; discovery will continue using [192.168.50.52:9300] from hosts providers and [{EpNodeSlave}{Qc9NeP4gRNKhh_m05SHerw}{aN-GkdEcT6qeljI-nvvUeA}{192.168.50.78}{192.168.50.78:9300}{cdfhilmrstw}] from last-known cluster state; node term 1, last-accepted version 0 in term 0
[2021-07-02T23:59:20,029][WARN ][o.e.c.c.ClusterFormationFailureHelper] [EpNodeSlave] master not discovered yet, this node has not previously joined a bootstrapped (v7+) cluster, and this node must discover master-eligible nodes [EpNodeMaster] to bootstrap a cluster: have discovered [{EpNodeSlave}{Qc9NeP4gRNKhh_m05SHerw}{aN-GkdEcT6qeljI-nvvUeA}{192.168.50.78}{192.168.50.78:9300}{cdfhilmrstw}]; discovery will continue using [192.168.50.52:9300] from hosts providers and [{EpNodeSlave}{Qc9NeP4gRNKhh_m05SHerw}{aN-GkdEcT6qeljI-nvvUeA}{192.168.50.78}{192.168.50.78:9300}{cdfhilmrstw}] from last-known cluster state; node term 1, last-accepted version 0 in term 0
[2021-07-02T23:59:30,030][WARN ][o.e.c.c.ClusterFormationFailureHelper] [EpNodeSlave] master not discovered yet, this node has not previously joined a bootstrapped (v7+) cluster, and this node must discover master-eligible nodes [EpNodeMaster] to bootstrap a cluster: have discovered [{EpNodeSlave}{Qc9NeP4gRNKhh_m05SHerw}{aN-GkdEcT6qeljI-nvvUeA}{192.168.50.78}{192.168.50.78:9300}{cdfhilmrstw}]; discovery will continue using [192.168.50.52:9300] from hosts providers and [{EpNodeSlave}{Qc9NeP4gRNKhh_m05SHerw}{aN-GkdEcT6qeljI-nvvUeA}{192.168.50.78}{192.168.50.78:9300}{cdfhilmrstw}] from last-known cluster state; node term 1, last-accepted version 0 in term 0
[2021-07-02T23:59:40,031][WARN ][o.e.c.c.ClusterFormationFailureHelper] [EpNodeSlave] master not discovered yet, this node has not previously joined a bootstrapped (v7+) cluster, and this node must discover master-eligible nodes [EpNodeMaster] to bootstrap a cluster: have discovered [{EpNodeSlave}{Qc9NeP4gRNKhh_m05SHerw}{aN-GkdEcT6qeljI-nvvUeA}{192.168.50.78}{192.168.50.78:9300}{cdfhilmrstw}]; discovery will continue using [192.168.50.52:9300] from hosts providers and [{EpNodeSlave}{Qc9NeP4gRNKhh_m05SHerw}{aN-GkdEcT6qeljI-nvvUeA}{192.168.50.78}{192.168.50.78:9300}{cdfhilmrstw}] from last-known cluster state; node term 1, last-accepted version 0 in term 0
[2021-07-02T23:59:50,064][WARN ][o.e.c.c.ClusterFormationFailureHelper] [EpNodeSlave] master not discovered yet, this node has not previously joined a bootstrapped (v7+) cluster, and this node must discover master-eligible nodes [EpNodeMaster] to bootstrap a cluster: have discovered [{EpNodeSlave}{Qc9NeP4gRNKhh_m05SHerw}{aN-GkdEcT6qeljI-nvvUeA}{192.168.50.78}{192.168.50.78:9300}{cdfhilmrstw}]; discovery will continue using [192.168.50.52:9300] from hosts providers and [{EpNodeSlave}{Qc9NeP4gRNKhh_m05SHerw}{aN-GkdEcT6qeljI-nvvUeA}{192.168.50.78}{192.168.50.78:9300}{cdfhilmrstw}] from last-known cluster state; node term 1, last-accepted version 0 in term 0

It seems that the second node cannot reach master.

[2021-07-02T23:59:50,064][WARN ][o.e.c.c.ClusterFormationFailureHelper] [EpNodeSlave] master not discovered yet, this node has not previously joined a bootstrapped (v7+) cluster, and this node must discover master-eligible nodes [EpNodeMaster] to bootstrap a cluster: have discovered [{EpNodeSlave}{Qc9NeP4gRNKhh_m05SHerw}{aN-GkdEcT6qeljI-nvvUeA}{192.168.50.78}{192.168.50.78:9300}{cdfhilmrstw}]; discovery will continue using [192.168.50.52:9300] from hosts providers and [{EpNodeSlave}{Qc9NeP4gRNKhh_m05SHerw}{aN-GkdEcT6qeljI-nvvUeA}{192.168.50.78}{192.168.50.78:9300}{cdfhilmrstw}] from last-known cluster state; node term 1, last-accepted version 0 in term 0

If you get into the second node terminal can you ping the master node?

On the kibana side it seems that the second node is unreachable as well:

PUT http://192.168.50.78:9200/_template/.management-beats => connect EHOSTUNREACH 192.168.50.78:9200

Sorry, I forgot to stop firewalld. Now, there is the log:

Kibana:

  log   [00:17:30.712] [info][plugins][taskManager] TaskManager is identified by the Kibana UUID: 9300b3ae-83ba-4211-945c-93007d4617b1
  log   [00:17:30.910] [warning][config][plugins][security] Generating a random key for xpack.security.encryptionKey. To prevent sessions from being invalidated on restart, please set xpack.security.encryptionKey in the kibana.yml or use the bin/kibana-encryption-keys command.
  log   [00:17:30.910] [warning][config][plugins][security] Session cookies will be transmitted over insecure connections. This is not recommended.
  log   [00:17:30.953] [warning][config][plugins][reporting] Generating a random key for xpack.reporting.encryptionKey. To prevent sessions from being invalidated on restart, please set xpack.reporting.encryptionKey in the kibana.yml or use the bin/kibana-encryption-keys command.
  log   [00:17:30.958] [warning][config][plugins][reporting] Chromium sandbox provides an additional layer of protection, but is not supported for Linux CentOS 7.9.2009 OS. Automatically setting 'xpack.reporting.capture.browser.chromium.disableSandbox: true'.
  log   [00:17:30.959] [warning][encryptedSavedObjects][plugins] Saved objects encryption key is not set. This will severely limit Kibana functionality. Please set xpack.encryptedSavedObjects.encryptionKey in the kibana.yml or use the bin/kibana-encryption-keys command.
  log   [00:17:31.031] [warning][actions][actions][plugins] APIs are disabled because the Encrypted Saved Objects plugin is missing encryption key. Please set xpack.encryptedSavedObjects.encryptionKey in the kibana.yml or use the bin/kibana-encryption-keys command.
  log   [00:17:31.040] [warning][alerting][alerting][plugins][plugins] APIs are disabled because the Encrypted Saved Objects plugin is missing encryption key. Please set xpack.encryptedSavedObjects.encryptionKey in the kibana.yml or use the bin/kibana-encryption-keys command.
  log   [00:17:31.093] [info][monitoring][monitoring][plugins] config sourced from: production cluster
  log   [00:17:31.265] [info][savedobjects-service] Waiting until all Elasticsearch nodes are compatible with Kibana before starting saved objects migrations...
  log   [00:17:31.369] [info][savedobjects-service] Starting saved objects migrations
  log   [00:17:31.401] [error][savedobjects-service] [.kibana] Action failed with 'connect ECONNREFUSED 192.168.50.78:9200'. Retrying attempt 1 in 2 seconds.
  log   [00:17:31.401] [info][savedobjects-service] [.kibana] INIT -> INIT. took: 11ms.
  log   [00:17:31.404] [info][savedobjects-service] [.kibana_task_manager] INIT -> OUTDATED_DOCUMENTS_SEARCH. took: 12ms.
  log   [00:17:31.484] [info][savedobjects-service] [.kibana_task_manager] OUTDATED_DOCUMENTS_SEARCH -> UPDATE_TARGET_MAPPINGS. took: 80ms.
  log   [00:17:31.525] [info][savedobjects-service] [.kibana_task_manager] UPDATE_TARGET_MAPPINGS -> UPDATE_TARGET_MAPPINGS_WAIT_FOR_TASK. took: 41ms.
  log   [00:17:31.759] [info][savedobjects-service] [.kibana_task_manager] UPDATE_TARGET_MAPPINGS_WAIT_FOR_TASK -> DONE. took: 234ms.
  log   [00:17:31.760] [info][savedobjects-service] [.kibana_task_manager] Migration completed after 368ms
  log   [00:17:33.413] [info][savedobjects-service] [.kibana] INIT -> OUTDATED_DOCUMENTS_SEARCH. took: 2012ms.
  log   [00:17:33.436] [info][savedobjects-service] [.kibana] OUTDATED_DOCUMENTS_SEARCH -> UPDATE_TARGET_MAPPINGS. took: 23ms.
  log   [00:17:33.535] [info][savedobjects-service] [.kibana] UPDATE_TARGET_MAPPINGS -> UPDATE_TARGET_MAPPINGS_WAIT_FOR_TASK. took: 99ms.
  log   [00:17:33.752] [info][savedobjects-service] [.kibana] UPDATE_TARGET_MAPPINGS_WAIT_FOR_TASK -> DONE. took: 217ms.
  log   [00:17:33.752] [info][savedobjects-service] [.kibana] Migration completed after 2362ms
  log   [00:17:33.776] [info][plugins-system] Starting [106] plugins: [taskManager,licensing,globalSearch,globalSearchProviders,banners,code,usageCollection,xpackLegacy,telemetryCollectionManager,telemetry,telemetryCollectionXpack,kibanaUsageCollection,kibanaLegacy,newsfeed,securityOss,share,mapsEms,mapsLegacy,translations,licenseApiGuard,esUiShared,legacyExport,embeddable,uiActionsEnhanced,expressions,charts,bfetch,data,home,console,consoleExtensions,apmOss,searchprofiler,painlessLab,grokdebugger,management,advancedSettings,savedObjects,visualizations,visTypeTimelion,features,licenseManagement,watcher,visTypeTagcloud,visTypeVega,visTypeTable,visTypeVislib,visTypeMetric,visTypeMarkdown,visTypeXy,tileMap,regionMap,presentationUtil,canvas,graph,timelion,dashboard,dashboardEnhanced,visualize,visTypeTimeseries,inputControlVis,indexPatternManagement,discover,discoverEnhanced,savedObjectsManagement,spaces,security,beatsManagement,savedObjectsTagging,lens,reporting,lists,encryptedSavedObjects,dataEnhanced,dashboardMode,cloud,upgradeAssistant,snapshotRestore,fleet,indexManagement,rollup,remoteClusters,crossClusterReplication,indexLifecycleManagement,enterpriseSearch,transform,ingestPipelines,fileUpload,maps,fileDataVisualizer,eventLog,actions,alerting,triggersActionsUi,osquery,stackAlerts,ruleRegistry,observability,ml,securitySolution,cases,infra,monitoring,logstash,apm,uptime]
  log   [00:17:35.924] [info][server][Kibana][http] http server running at http://0.0.0.0:5601
  log   [00:17:35.940] [error][elasticsearch] Request error, retrying
GET http://192.168.50.78:9200/_xpack?accept_enterprise=true => connect ECONNREFUSED 192.168.50.78:9200
  log   [00:17:36.049] [info][kibana-monitoring][monitoring][monitoring][plugins] Starting monitoring stats collection
  log   [00:17:36.178] [error][fleet][plugins] Setup for central management of agents failed.
  log   [00:17:36.178] [error][fleet][plugins] ConnectionError: connect ECONNREFUSED 192.168.50.78:9200
    at ClientRequest.onError (/home/epi/kibana-7.13.2-linux-x86_64/node_modules/@elastic/elasticsearch/lib/Connection.js:115:16)
    at ClientRequest.emit (events.js:315:20)
    at Socket.socketErrorListener (_http_client.js:469:9)
    at Socket.emit (events.js:315:20)
    at emitErrorNT (internal/streams/destroy.js:106:8)
    at emitErrorCloseNT (internal/streams/destroy.js:74:3)
    at processTicksAndRejections (internal/process/task_queues.js:80:21) {
  meta: {
    body: null,
    statusCode: null,
    headers: null,
    meta: {
      context: null,
      request: [Object],
      name: 'elasticsearch-js',
      connection: [Object],
      attempts: 0,
      aborted: false
    }
  },
  isBoom: true,
  isServer: true,
  data: null,
  output: {
    statusCode: 503,
    payload: {
      statusCode: 503,
      error: 'Service Unavailable',
      message: 'connect ECONNREFUSED 192.168.50.78:9200'
    },
    headers: {}
  },
  [Symbol(SavedObjectsClientErrorCode)]: 'SavedObjectsClient/esUnavailable'
}
  log   [00:17:36.192] [info][plugins][securitySolution] Dependent plugin setup complete - Starting ManifestTask
  log   [00:17:36.604] [info][plugins][reporting] Browser executable: /home/epi/kibana-7.13.2-linux-x86_64/x-pack/plugins/reporting/chromium/headless_shell-linux_x64/headless_shell
  log   [00:17:36.604] [warning][plugins][reporting] Enabling the Chromium sandbox provides an additional layer of protection.
  log   [00:17:53.317] [error][monitoring][monitoring][plugins] StatusCodeError: [cluster_block_exception] blocked by: [SERVICE_UNAVAILABLE/1/state not recovered / initialized];
    at respond (/home/epi/kibana-7.13.2-linux-x86_64/node_modules/elasticsearch/src/lib/transport.js:349:15)
    at checkRespForFailure (/home/epi/kibana-7.13.2-linux-x86_64/node_modules/elasticsearch/src/lib/transport.js:306:7)
    at HttpConnector.<anonymous> (/home/epi/kibana-7.13.2-linux-x86_64/node_modules/elasticsearch/src/lib/connectors/http.js:173:7)
    at IncomingMessage.wrapper (/home/epi/kibana-7.13.2-linux-x86_64/node_modules/lodash/lodash.js:4991:19)
    at IncomingMessage.emit (events.js:327:22)
    at endReadableNT (internal/streams/readable.js:1327:12)
    at processTicksAndRejections (internal/process/task_queues.js:80:21) {
  status: 503,
  displayName: 'ServiceUnavailable',
  path: '/*%3A.monitoring-logstash-6-*%2C*%3A.monitoring-logstash-7-*%2C.monitoring-logstash-6-*%2C.monitoring-logstash-7-*%2Cmetricbeat-*%2C*%3A.monitoring-beats-6-*%2C*%3A.monitoring-beats-7-*%2C.monitoring-beats-6-*%2C.monitoring-beats-7-*%2Cmetricbeat-*%2C*%3A.monitoring-beats-6-*%2C*%3A.monitoring-beats-7-*%2C.monitoring-beats-6-*%2C.monitoring-beats-7-*%2Cmetricbeat-*/_search',
  query: {},
  body: {
    error: {
      root_cause: [Array],
      type: 'cluster_block_exception',
      reason: 'blocked by: [SERVICE_UNAVAILABLE/1/state not recovered / initialized];'
    },
    status: 503
  },
  statusCode: 503,
  response: '{"error":{"root_cause":[{"type":"cluster_block_exception","reason":"blocked by: [SERVICE_UNAVAILABLE/1/state not recovered / initialized];"}],"type":"cluster_block_exception","reason":"blocked by: [SERVICE_UNAVAILABLE/1/state not recovered / initialized];"},"status":503}',
  toString: [Function (anonymous)],
  toJSON: [Function (anonymous)]
}
  log   [00:18:05.976] [warning][monitoring][monitoring][plugins] X-Pack Monitoring Cluster Alerts will not be available: X-Pack plugin is not installed on the Elasticsearch cluster.

The EpCluster.log on EpNodeSlave

Caused by: java.lang.IllegalArgumentException: can't add node {EpNodeSlave}{Qc9NeP4gRNKhh_m05SHerw}{xHgZXIRYS_-_mhDjH8hUmQ}{192.168.50.78}{192.168.50.78:9300}{cdfhilmrstw}{ml.machine_memory=10566320128, ml.max_open_jobs=512, xpack.installed=true, ml.max_jvm_size=5284823040, transform.node=true}, found existing node {EpNodeMaster}{Qc9NeP4gRNKhh_m05SHerw}{ryfA6PeaS4uBAj6lDQELDw}{192.168.50.52}{192.168.50.52:9300}{cdfhilmrstw}{ml.machine_memory=10566320128, xpack.installed=true, transform.node=true, ml.max_open_jobs=512, ml.max_jvm_size=5284823040} with the same id but is a different node instance
        at org.elasticsearch.cluster.node.DiscoveryNodes$Builder.add(DiscoveryNodes.java:634) ~[elasticsearch-7.13.2.jar:7.13.2]
        at org.elasticsearch.cluster.coordination.JoinTaskExecutor.execute(JoinTaskExecutor.java:148) ~[elasticsearch-7.13.2.jar:7.13.2]
        at org.elasticsearch.cluster.coordination.JoinHelper$1.execute(JoinHelper.java:124) ~[elasticsearch-7.13.2.jar:7.13.2]
        at org.elasticsearch.cluster.service.MasterService.executeTasks(MasterService.java:691) ~[elasticsearch-7.13.2.jar:7.13.2]
        at org.elasticsearch.cluster.service.MasterService.calculateTaskOutputs(MasterService.java:313) ~[elasticsearch-7.13.2.jar:7.13.2]
        at org.elasticsearch.cluster.service.MasterService.runTasks(MasterService.java:208) ~[elasticsearch-7.13.2.jar:7.13.2]
        at org.elasticsearch.cluster.service.MasterService.access$000(MasterService.java:62) ~[elasticsearch-7.13.2.jar:7.13.2]
        at org.elasticsearch.cluster.service.MasterService$Batcher.run(MasterService.java:140) ~[elasticsearch-7.13.2.jar:7.13.2]
        at org.elasticsearch.cluster.service.TaskBatcher.runIfNotProcessed(TaskBatcher.java:139) ~[elasticsearch-7.13.2.jar:7.13.2]
        at org.elasticsearch.cluster.service.TaskBatcher$BatchedTask.run(TaskBatcher.java:177) ~[elasticsearch-7.13.2.jar:7.13.2]
        at org.elasticsearch.common.util.concurrent.ThreadContext$ContextPreservingRunnable.run(ThreadContext.java:673) ~[elasticsearch-7.13.2.jar:7.13.2]
        at org.elasticsearch.common.util.concurrent.PrioritizedEsThreadPoolExecutor$TieBreakingPrioritizedRunnable.runAndClean(PrioritizedEsThreadPoolExecutor.java:241) ~[elasticsearch-7.13.2.jar:7.13.2]
        at org.elasticsearch.common.util.concurrent.PrioritizedEsThreadPoolExecutor$TieBreakingPrioritizedRunnable.run(PrioritizedEsThreadPoolExecutor.java:204) ~[elasticsearch-7.13.2.jar:7.13.2]
        at java.util.concurrent.ThreadPoolExecutor.runWorker(ThreadPoolExecutor.java:1130) ~[?:?]
        at java.util.concurrent.ThreadPoolExecutor$Worker.run(ThreadPoolExecutor.java:630) ~[?:?]
        at java.lang.Thread.run(Thread.java:831) [?:?]

Is something wrong with EpNodeSlave

I request http://192.168.50.78:9200/, this is the response:

{
  "name" : "EpNodeSlave",
  "cluster_name" : "EpCluster",
  "cluster_uuid" : "_na_",
  "version" : {
    "number" : "7.13.2",
    "build_flavor" : "default",
    "build_type" : "tar",
    "build_hash" : "4d960a0733be83dd2543ca018aa4ddc42e956800",
    "build_date" : "2021-06-10T21:01:55.251515791Z",
    "build_snapshot" : false,
    "lucene_version" : "8.8.2",
    "minimum_wire_compatibility_version" : "6.8.0",
    "minimum_index_compatibility_version" : "6.0.0-beta1"
  },
  "tagline" : "You Know, for Search"
}

Maybe cluster_uuid is something wrong?

If you get into the second node terminal can you ping the master node?

[epi@epnodeslave config]$ ping 192.168.50.52
PING 192.168.50.52 (192.168.50.52) 56(84) bytes of data.
64 bytes from 192.168.50.52: icmp_seq=1 ttl=64 time=0.155 ms
64 bytes from 192.168.50.52: icmp_seq=2 ttl=64 time=0.193 ms
64 bytes from 192.168.50.52: icmp_seq=3 ttl=64 time=0.219 ms
64 bytes from 192.168.50.52: icmp_seq=4 ttl=64 time=0.218 ms
^C
--- 192.168.50.52 ping statistics ---
4 packets transmitted, 4 received, 0% packet loss, time 3139ms
rtt min/avg/max/mdev = 0.155/0.196/0.219/0.027 ms

The value _na_ indicates that the cluster is still forming: Cluster state API | Elasticsearch Guide [master] | Elastic

I see in your initial setup the cluster_uuid was correctly set though, so this feels another problem.

[epi@epnodeslave config]$ curl 127.0.0.1:9200/_cat/nodes
{"error":{"root_cause":[{"type":"master_not_discovered_exception","reason":null}],"type":"master_not_discovered_exception","reason":null},"status":503}
[epi@epnodemaster logs]$ curl 127.0.0.1:9200/_cat/nodes
192.168.50.52 24 63 1 0.00 0.20 0.51 cdfhilmrstw * EpNodeMaster

Hi @EpLiar

Hop you're doing well !!

I think the elasticsearch problem comes from the values ​​configured in the discovery.seed_hosts, when the elasticsearch service wants to start, the service will look for a node named 192.168.50.52 or 192.168.50.78 but it will find EpNodeMaster or EpNodeSlave, so it cannot build the cluster.

So to solve your problem, you need to replace the value of node.name with the IP address of the host for each service, or better, make sure your computer can resolve the IP address of the elasticsearch node from its name and configure Elasticsearch with that in the node.name and in the discovery.seed_hosts.

Hope that will help you

Mehdi

1 Like

Finally, I found the solution, thank you.

1 Like

This topic was automatically closed 28 days after the last reply. New replies are no longer allowed.