Hello,
I currently use graylog as SIEM. I kibana to install on the same server in order to better visualize the data. I created different extractors on graylog to have several fields extracted from the message:

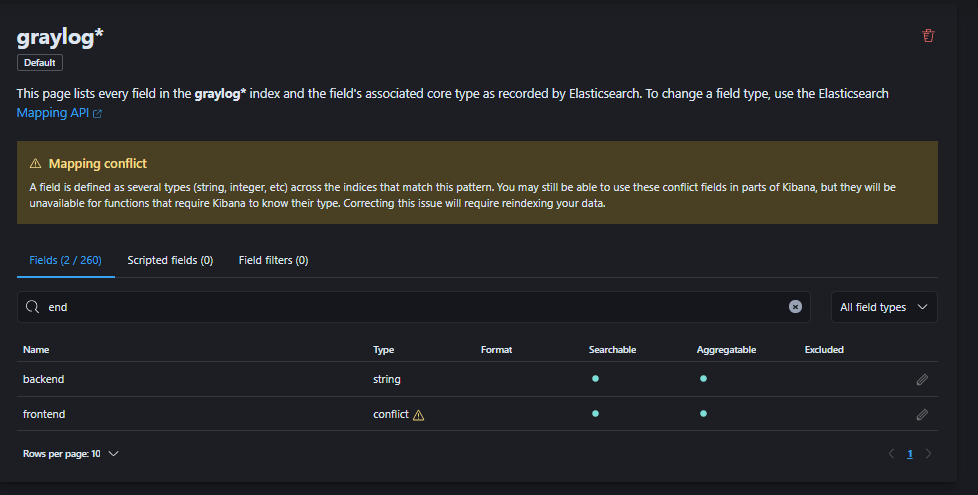
The problem is that on kibana, these fields do not necessarily appear and are not the same, I need them to create my dashboards
For example, the field ip_src, backend, frontend is missing here
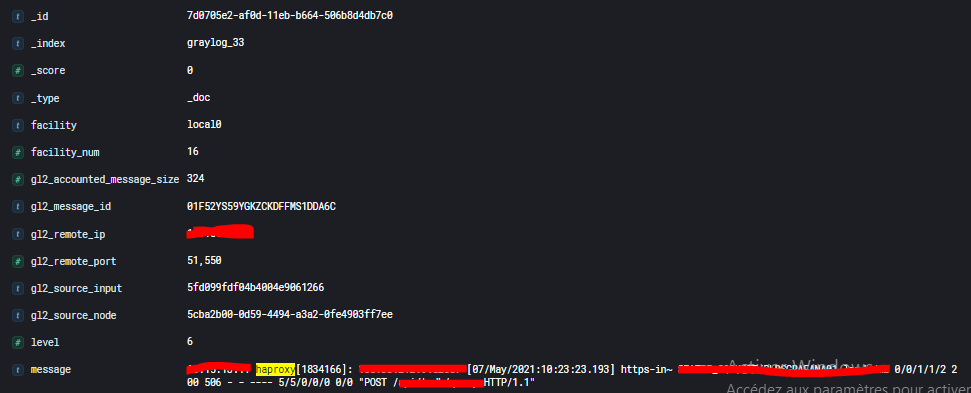
I try to find the solution but for the moment I can’t understand why the fields are not the same (for the haproxy logs in this case), knowing that for some messages (which come from something other than the haproxy) they are
Thank you