I'm attempting to spin up a ECK deployment using the fleet-apm config example at cloud-on-k8s/fleet-apm-integration.yaml at main · elastic/cloud-on-k8s · GitHub . The only change I've made is changing the count of Elasticsearch nodes to 1.
I've noticed that the fleet agent does not work with this config, failing to appear as an agent with the fleet policy in kibana.
Steps
- Start a new minikube cluster
- Create resource entries with
kubectl create -f https://download.elastic.co/downloads/eck/2.1.0/crds.yaml - Create operator with
kubectl apply -f https://download.elastic.co/downloads/eck/2.1.0 /operator.yaml - Create elastic cluster with
kubectl apply https://raw.githubusercontent.com/elastic/cloud-on-k8s/main/config/recipes/elastic-agent/fleet-apm-integration.yaml
All parts are green when running kubectl get elastic, but upon navigating to kibana->fleet I'm greeted by

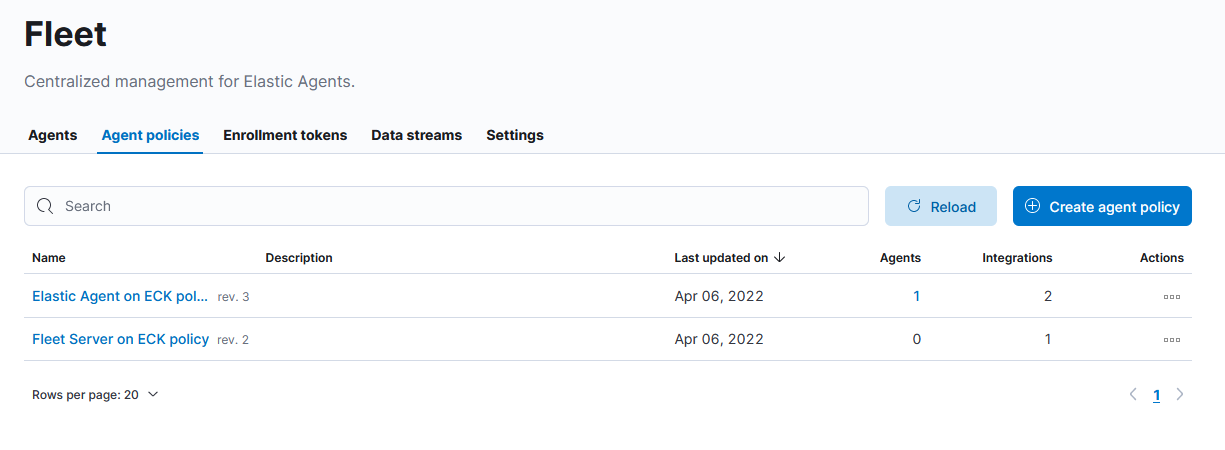
Going to the agent policies page, I can see that the agent that doesn't run fleet is enrolled with it's policy, but the fleet policy has no agents associated
The logs for the fleet server pod are as follows
Updating certificates in /etc/ssl/certs...
1 added, 0 removed; done.
Running hooks in /etc/ca-certificates/update.d...
done.
Requesting service_token from Kibana.
Created service_token named: token-1649287038511
Performing setup of Fleet in Kibana

{"log.level":"info","@timestamp":"2022-04-06T23:17:53.794Z","log.origin":{"file.name":"cmd/enroll_cmd.go","file.line":572},"message":"Spawning Elastic Agent daemon as a subprocess to complete bootstrap process.","ecs.version":"1.6.0"}
{"log.level":"info","@timestamp":"2022-04-06T23:17:54.077Z","log.origin":{"file.name":"application/application.go","file.line":68},"message":"Detecting execution mode","ecs.version":"1.6.0"}
{"log.level":"info","@timestamp":"2022-04-06T23:17:54.078Z","log.origin":{"file.name":"application/application.go","file.line":88},"message":"Agent is in Fleet Server bootstrap mode","ecs.version":"1.6.0"}
{"log.level":"info","@timestamp":"2022-04-06T23:17:54.870Z","log.origin":{"file.name":"cmd/enroll_cmd.go","file.line":744},"message":"Waiting for Elastic Agent to start Fleet Server","ecs.version":"1.6.0"}
{"log.level":"info","@timestamp":"2022-04-06T23:17:55.280Z","log.logger":"api","log.origin":{"file.name":"api/server.go","file.line":62},"message":"Starting stats endpoint","ecs.version":"1.6.0"}
{"log.level":"info","@timestamp":"2022-04-06T23:17:55.280Z","log.origin":{"file.name":"application/fleet_server_bootstrap.go","file.line":131},"message":"Agent is starting","ecs.version":"1.6.0"}
{"log.level":"info","@timestamp":"2022-04-06T23:17:55.280Z","log.logger":"api","log.origin":{"file.name":"api/server.go","file.line":64},"message":"Metrics endpoint listening on: /usr/share/elastic-agent/state/data/tmp/elastic-agent.sock (configured: unix:///usr/share/elastic-agent/state/data/tmp/elastic-agent.sock)","ecs.version":"1.6.0"}
{"log.level":"info","@timestamp":"2022-04-06T23:17:55.280Z","log.origin":{"file.name":"application/fleet_server_bootstrap.go","file.line":141},"message":"Agent is stopped","ecs.version":"1.6.0"}
{"log.level":"info","@timestamp":"2022-04-06T23:17:55.282Z","log.origin":{"file.name":"stateresolver/stateresolver.go","file.line":48},"message":"New State ID is VbEyWTf7","ecs.version":"1.6.0"}
{"log.level":"info","@timestamp":"2022-04-06T23:17:55.282Z","log.origin":{"file.name":"stateresolver/stateresolver.go","file.line":49},"message":"Converging state requires execution of 1 step(s)","ecs.version":"1.6.0"}
{"log.level":"info","@timestamp":"2022-04-06T23:17:57.479Z","log.origin":{"file.name":"log/reporter.go","file.line":40},"message":"2022-04-06T23:17:57Z - message: Application: fleet-server--8.1.1[]: State changed to STARTING: Starting - type: 'STATE' - sub_type: 'STARTING'","ecs.version":"1.6.0"}
{"log.level":"info","@timestamp":"2022-04-06T23:17:57.479Z","log.origin":{"file.name":"stateresolver/stateresolver.go","file.line":66},"message":"Updating internal state","ecs.version":"1.6.0"}
{"log.level":"warn","@timestamp":"2022-04-06T23:17:59.182Z","log.origin":{"file.name":"status/reporter.go","file.line":236},"message":"Elastic Agent status changed to: 'degraded'","ecs.version":"1.6.0"}
{"log.level":"info","@timestamp":"2022-04-06T23:17:59.182Z","log.origin":{"file.name":"log/reporter.go","file.line":40},"message":"2022-04-06T23:17:59Z - message: Application: fleet-server--8.1.1[]: State changed to DEGRADED: Running on default policy with Fleet Server integration; missing config fleet.agent.id (expected during bootstrap process) - type: 'STATE' - sub_type: 'RUNNING'","ecs.version":"1.6.0"}
{"log.level":"info","@timestamp":"2022-04-06T23:18:00.878Z","log.origin":{"file.name":"cmd/enroll_cmd.go","file.line":758},"message":"Fleet Server - Running on default policy with Fleet Server integration; missing config fleet.agent.id (expected during bootstrap process)","ecs.version":"1.6.0"}
{"log.level":"info","@timestamp":"2022-04-06T23:18:01.530Z","log.origin":{"file.name":"cmd/enroll_cmd.go","file.line":455},"message":"Starting enrollment to URL: https://fleet-server-agent-http.default.svc:8220/","ecs.version":"1.6.0"}
{"log.level":"warn","@timestamp":"2022-04-06T23:20:11.216Z","log.origin":{"file.name":"cmd/enroll_cmd.go","file.line":466},"message":"Remote server is not ready to accept connections, will retry in a moment.","ecs.version":"1.6.0"}
{"log.level":"info","@timestamp":"2022-04-06T23:21:11.217Z","log.origin":{"file.name":"cmd/enroll_cmd.go","file.line":473},"message":"Retrying enrollment to URL: https://fleet-server-agent-http.default.svc:8220/","ecs.version":"1.6.0"}
{"log.level":"warn","@timestamp":"2022-04-06T23:23:21.679Z","log.origin":{"file.name":"cmd/enroll_cmd.go","file.line":466},"message":"Remote server is not ready to accept connections, will retry in a moment.","ecs.version":"1.6.0"}
With the "retrying enrollment to url" and "Remote server is not ready to accept connections, will retry in a moment." logs repeating ad infinitum
Running kubectl describe agents.agent.k8s.elastic.co fleet-server claims the connection with Kibana is establisted. The output follows
Name:         fleet-server
Namespace:    default
Labels:       <none>
Annotations:  association.k8s.elastic.co/es-conf-1426228827:
                {"authSecretName":"fleet-server-default-elasticsearch-agent-user","authSecretKey":"default-fleet-server-default-elasticsearch-agent-user",...
              association.k8s.elastic.co/kb-conf:
                {"authSecretName":"fleet-server-agent-kb-user","authSecretKey":"default-fleet-server-agent-kb-user","caCertProvided":true,"caSecretName":"...
API Version:  agent.k8s.elastic.co/v1alpha1
Kind:         Agent
Metadata:
  Creation Timestamp:  2022-04-06T23:15:28Z
  Generation:          2
  Managed Fields:
    API Version:  agent.k8s.elastic.co/v1alpha1
    Fields Type:  FieldsV1
    fieldsV1:
      f:metadata:
        f:annotations:
          .:
          f:kubectl.kubernetes.io/last-applied-configuration:
      f:spec:
        .:
        f:deployment:
          .:
          f:podTemplate:
            .:
            f:spec:
              .:
              f:automountServiceAccountToken:
              f:securityContext:
                .:
                f:runAsUser:
              f:serviceAccountName:
          f:replicas:
        f:elasticsearchRefs:
        f:fleetServerEnabled:
        f:kibanaRef:
          .:
          f:name:
        f:mode:
        f:version:
    Manager:      kubectl-client-side-apply
    Operation:    Update
    Time:         2022-04-06T23:15:28Z
    API Version:  agent.k8s.elastic.co/v1alpha1
    Fields Type:  FieldsV1
    fieldsV1:
      f:metadata:
        f:annotations:
          f:association.k8s.elastic.co/es-conf-1426228827:
          f:association.k8s.elastic.co/kb-conf:
      f:spec:
        f:deployment:
          f:podTemplate:
            f:metadata:
              .:
              f:creationTimestamp:
            f:spec:
              f:containers:
          f:strategy:
        f:fleetServerRef:
          .:
          f:name:
        f:http:
          .:
          f:service:
            .:
            f:metadata:
            f:spec:
          f:tls:
            .:
            f:certificate:
    Manager:      elastic-operator
    Operation:    Update
    Time:         2022-04-06T23:15:29Z
    API Version:  agent.k8s.elastic.co/v1alpha1
    Fields Type:  FieldsV1
    fieldsV1:
      f:status:
        .:
        f:availableNodes:
        f:elasticsearchAssociationsStatus:
          .:
          f:default/elasticsearch:
        f:expectedNodes:
        f:health:
        f:kibanaAssociationStatus:
        f:version:
    Manager:         elastic-operator
    Operation:       Update
    Subresource:     status
    Time:            2022-04-06T23:17:13Z
  Resource Version:  1760
  UID:               560c60a7-cde9-4b1a-8c7a-8f7efb898200
Spec:
  Deployment:
    Pod Template:
      Metadata:
        Creation Timestamp:  <nil>
      Spec:
        Automount Service Account Token:  true
        Containers:                       <nil>
        Security Context:
          Run As User:         0
        Service Account Name:  fleet-server
    Replicas:                  1
    Strategy:
  Elasticsearch Refs:
    Name:                elasticsearch
  Fleet Server Enabled:  true
  Fleet Server Ref:
    Name:
  Http:
    Service:
      Metadata:
      Spec:
    Tls:
      Certificate:
  Kibana Ref:
    Name:   kibana
  Mode:     fleet
  Version:  8.1.1
Status:
  Available Nodes:  1
  Elasticsearch Associations Status:
    default/elasticsearch:    Established
  Expected Nodes:             1
  Health:                     green
  Kibana Association Status:  Established
  Version:                    8.1.1
Events:
  Type     Reason                   Age                    From                                 Message
  ----     ------                   ----                   ----                                 -------
  Warning  AssociationError         7m49s (x4 over 7m49s)  agent-controller                     Association backend for elasticsearch is not configured
  Normal   AssociationStatusChange  7m49s                  agent-es-association-controller      Association status changed from [] to [default/elasticsearch: Pending]
  Normal   AssociationStatusChange  7m49s                  agent-kibana-association-controller  Association status changed from [] to [Pending]
  Warning  AssociationError         7m49s (x3 over 7m49s)  agent-controller                     Association backend for kibana is not configured
  Normal   AssociationStatusChange  7m49s                  agent-es-association-controller      Association status changed from [default/elasticsearch: Pending] to [default/elasticsearch: Established]
  Normal   AssociationStatusChange  7m48s                  agent-kibana-association-controller  Association status changed from [Pending] to [Established]