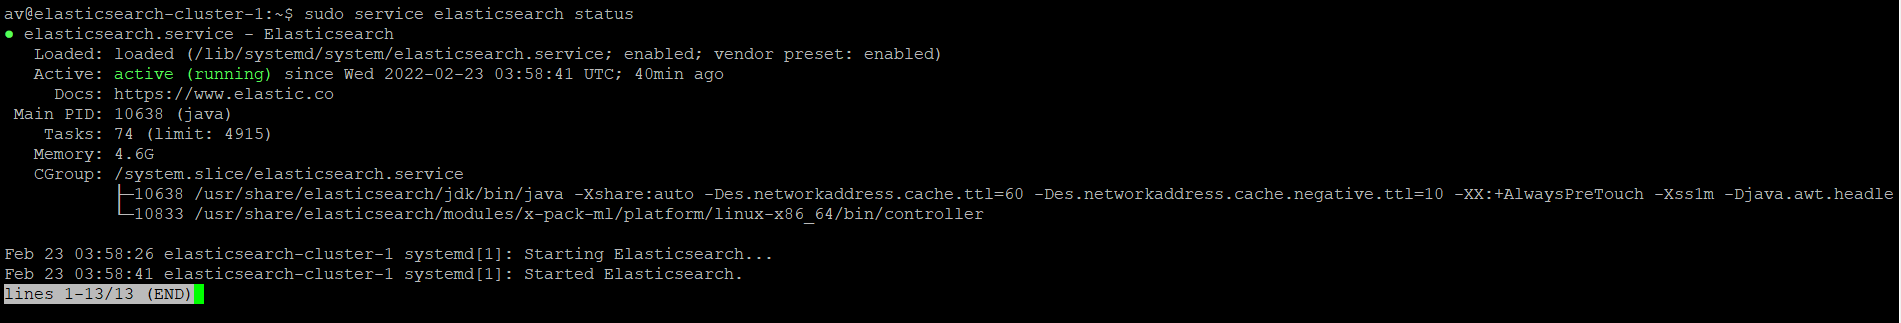
I've configured a 3 node ES cluster and installed kibana and made it point to the cluster. Both ES an Kibana services are up, but the kibana portal is still not loading.
I dont see any errors in ES logs, on error log in kibana logs is as below
{"type":"log","@timestamp":"2022-02-23T03:59:27+00:00","tags":["error","plugins","taskManager"],"pid":10523,"message":"Failed to poll for work: Error: work has timed out"}

Kibana Config
server.port: 8443
server.host: "master-node-ip"
server.publicBaseUrl: "https://master-node-ip:8443"
elasticsearch.hosts: ["http://master-node-ip:9200","http://node-2-ip:9200","http://node-3-ip:9200"]
server.ssl.enabled: true
server.ssl.certificate: /ca/ca.crt
server.ssl.key: /ca/ca.key
ES master node config
network.host: master-node-ip
http.port: 9200
discovery.seed_hosts: ["node-2-ip", "master-node-ip", "node-3-ip"]
cluster.initial_master_nodes: ["es-1"]
ES node 2 config
network.host: node-2-ip
http.port: 9200
discovery.seed_hosts: ["node-2-ip", "master-node-ip", "node-3-ip"]
cluster.initial_master_nodes: ["es-2"]
ES node 3 config
network.host: node-3-ip
http.port: 9200
discovery.seed_hosts: ["node-2-ip", "master-node-ip", "node-3-ip"]
cluster.initial_master_nodes: ["es-3"]
curl outputs on all 3 ES nodes
Master
{
  "cluster_name" : "es-crybit",
  "status" : "green",
  "timed_out" : false,
  "number_of_nodes" : 1,
  "number_of_data_nodes" : 1,
  "active_primary_shards" : 9,
  "active_shards" : 9,
  "relocating_shards" : 0,
  "initializing_shards" : 0,
  "unassigned_shards" : 0,
  "delayed_unassigned_shards" : 0,
  "number_of_pending_tasks" : 0,
  "number_of_in_flight_fetch" : 0,
  "task_max_waiting_in_queue_millis" : 0,
  "active_shards_percent_as_number" : 100.0
}
Node 2
{
  "cluster_name" : "es-crybit",
  "status" : "green",
  "timed_out" : false,
  "number_of_nodes" : 2,
  "number_of_data_nodes" : 2,
  "active_primary_shards" : 3,
  "active_shards" : 6,
  "relocating_shards" : 0,
  "initializing_shards" : 0,
  "unassigned_shards" : 0,
  "delayed_unassigned_shards" : 0,
  "number_of_pending_tasks" : 0,
  "number_of_in_flight_fetch" : 0,
  "task_max_waiting_in_queue_millis" : 0,
  "active_shards_percent_as_number" : 100.0
}
Node 3
{
  "cluster_name" : "es-crybit",
  "status" : "green",
  "timed_out" : false,
  "number_of_nodes" : 2,
  "number_of_data_nodes" : 2,
  "active_primary_shards" : 3,
  "active_shards" : 6,
  "relocating_shards" : 0,
  "initializing_shards" : 0,
  "unassigned_shards" : 0,
  "delayed_unassigned_shards" : 0,
  "number_of_pending_tasks" : 0,
  "number_of_in_flight_fetch" : 0,
  "task_max_waiting_in_queue_millis" : 0,
  "active_shards_percent_as_number" : 100.0
}