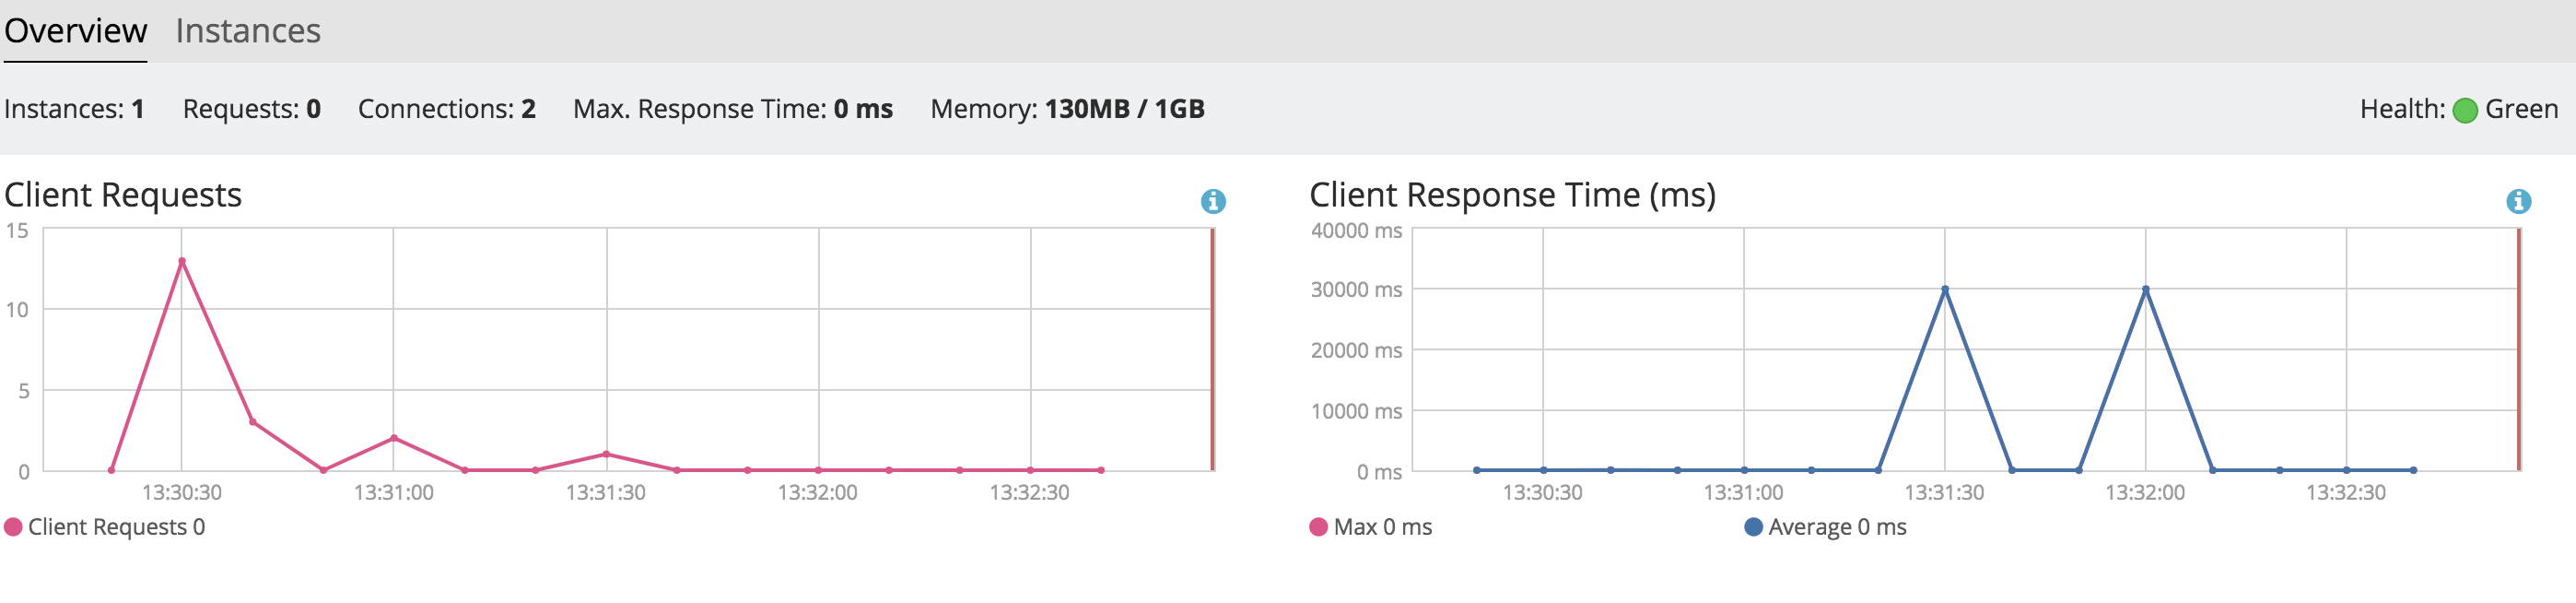
So I am having an issue with Kibana, when trying to create visualizations, it tells me that it timed out after 30k ms and then about 2-3 minutes later in the visualizations tab I see the visualization twice.
Looking at the .kibana index for the time this event occurred I can see two times that it appears that it made the call at 13:31 and 13:31:30
Looking at the .kibana Index I don't see anything out of the ordinary

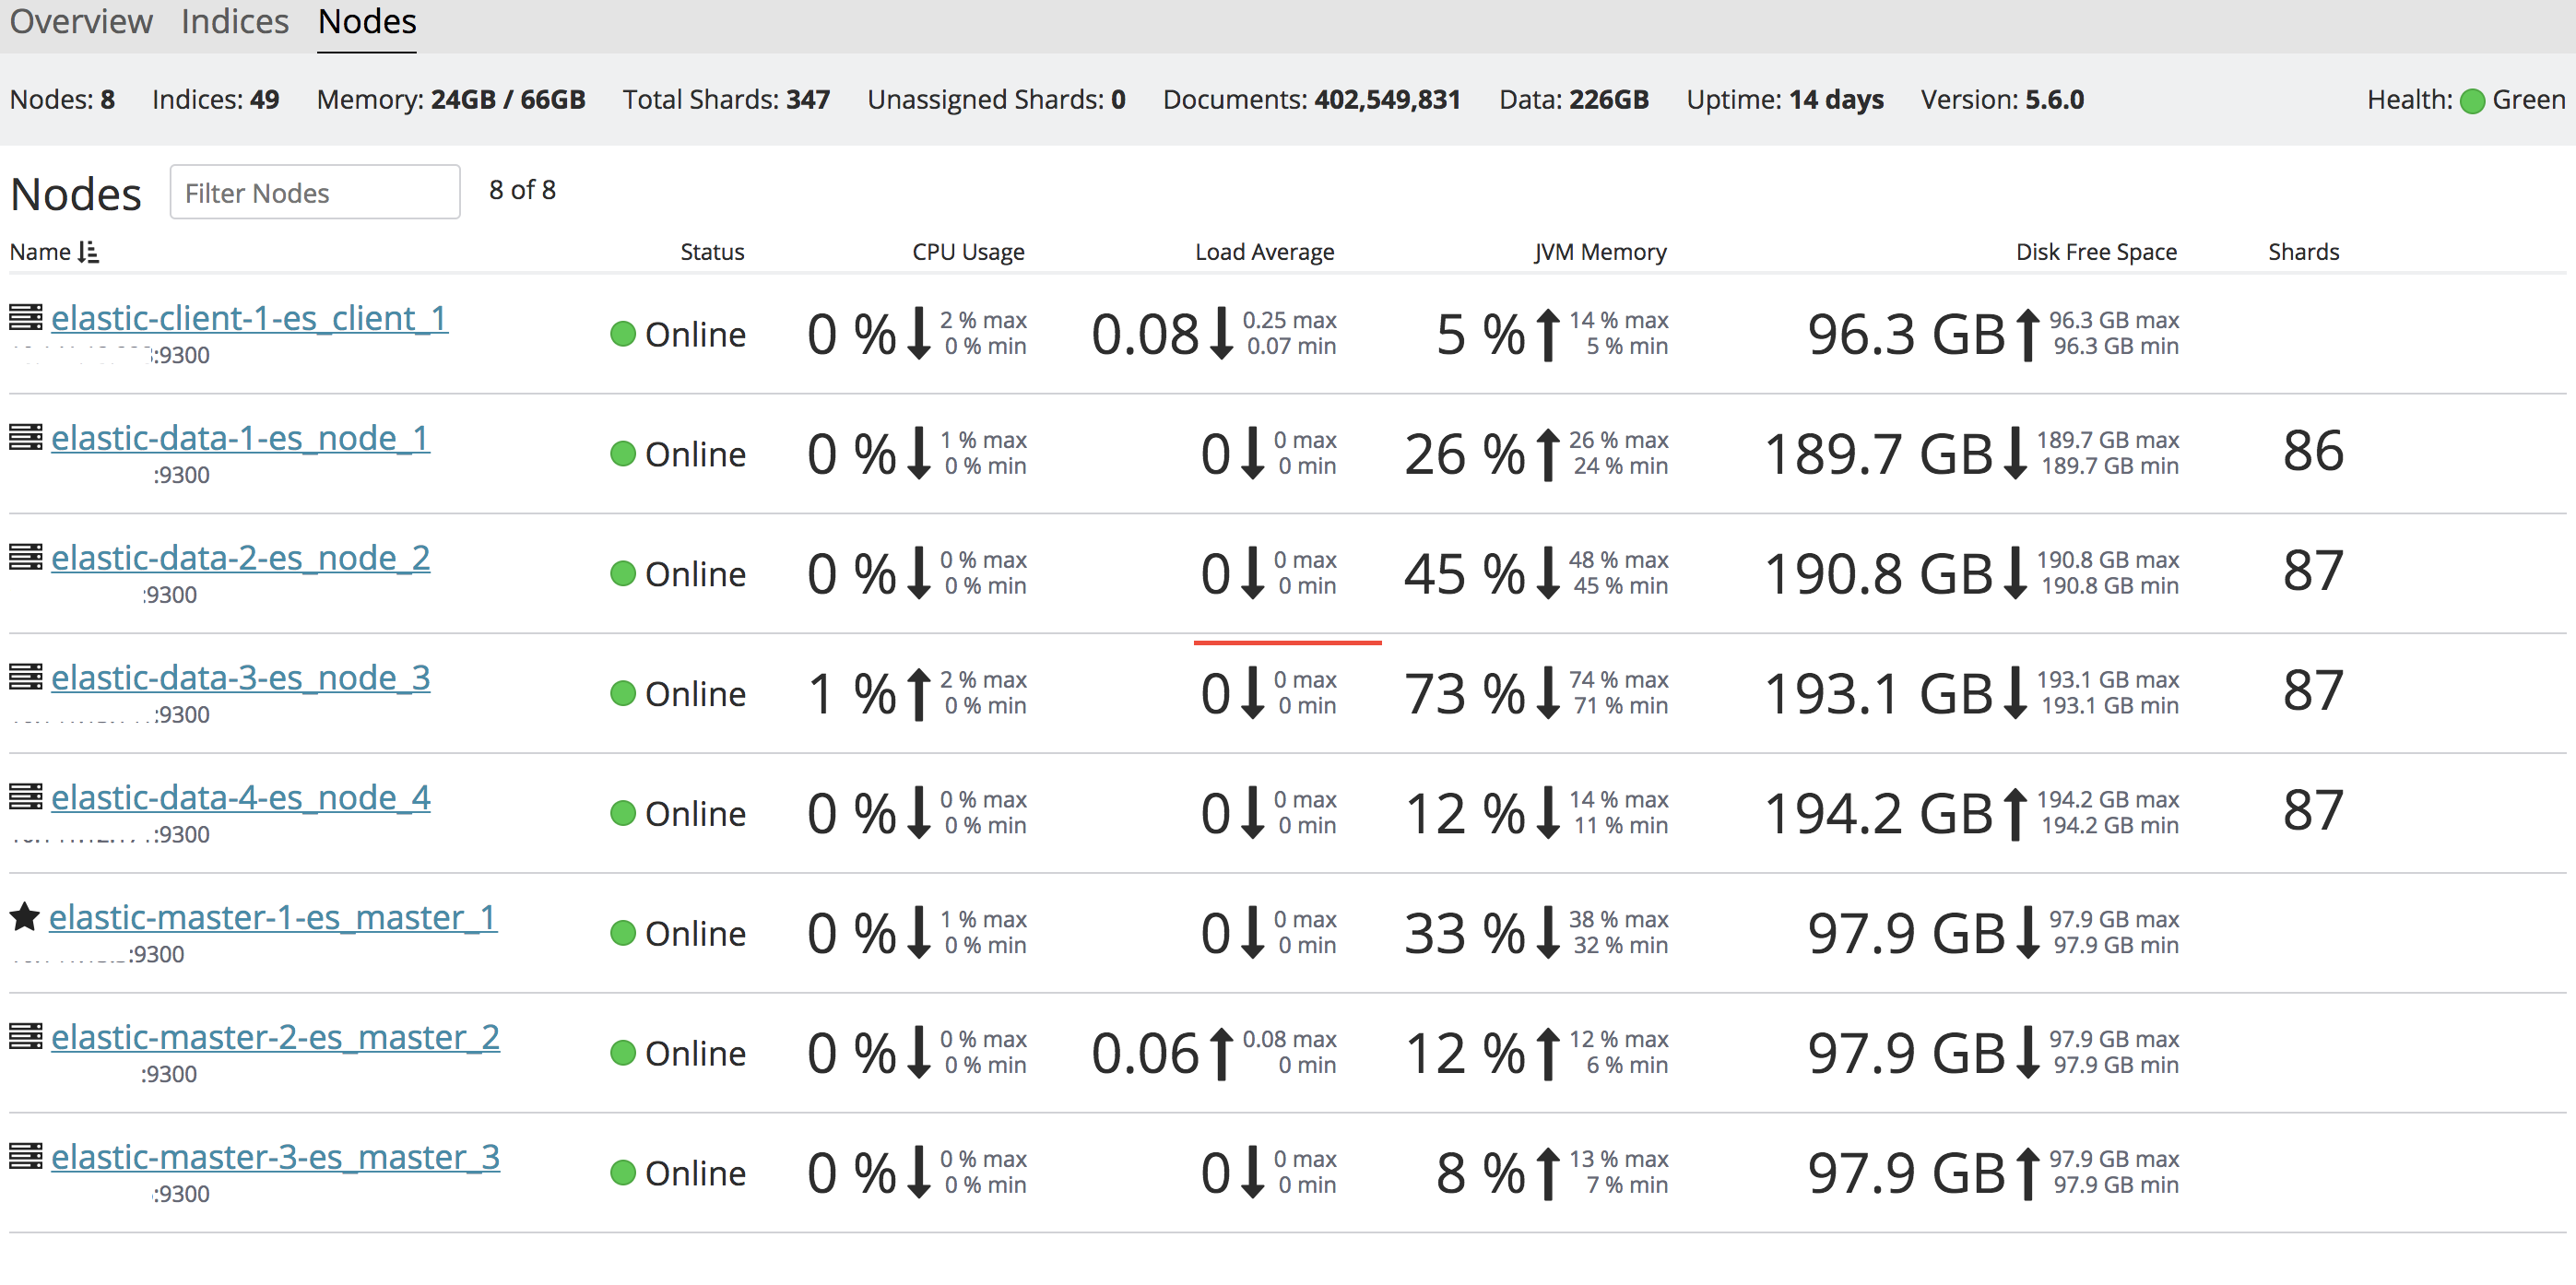
This is the current cluster setup, the Kibana instance is co-located with elastic-client-1 and points to it.
Elastic Version: 5.6.0
Kibana Version: 5.6.2
Querying does not cause a timeout, it seems that only saving visualizations causes timeouts. I even upgraded the instance that Kibana and the client node were on, to improve the networking, and I am encountering the same problem.