Dear everyone,
Could you please help me solve a problem "kibana server not ready yet" although Elasticsearch and kibana service is running. Attached is the kibana log file.
Thank you so much for your help

Hi @dat_nguyen
Welcome to the community !
Is this a fresh installation? What version and have you checked Elasticsearch is up and running correctly ?
curl -X GET ":9200/_cat/health?v=true&pretty"
There is the error message "waiting until all the Elastic nodes have the same version".
Did you check this aspect?

Hi Roger,
I tried create the new node, but still same problem
How many Elasticsearch Nodes do you have ? If it is one have you set this up correctly in the elasticsearch.yml file (Discovery-Type) ? Can you share that with us? Also check the indices:-
curl -X GET "http:// IP Address:9200/_cluster/health?pretty"


Hello,
Please avoid posting screenshots, they are very hard to read, some people may not be able to see it at all and it is impossible to reproduce anything if it is needed, copy and share the texts using the preformatted text button (</>).
Hi leandrojmp,
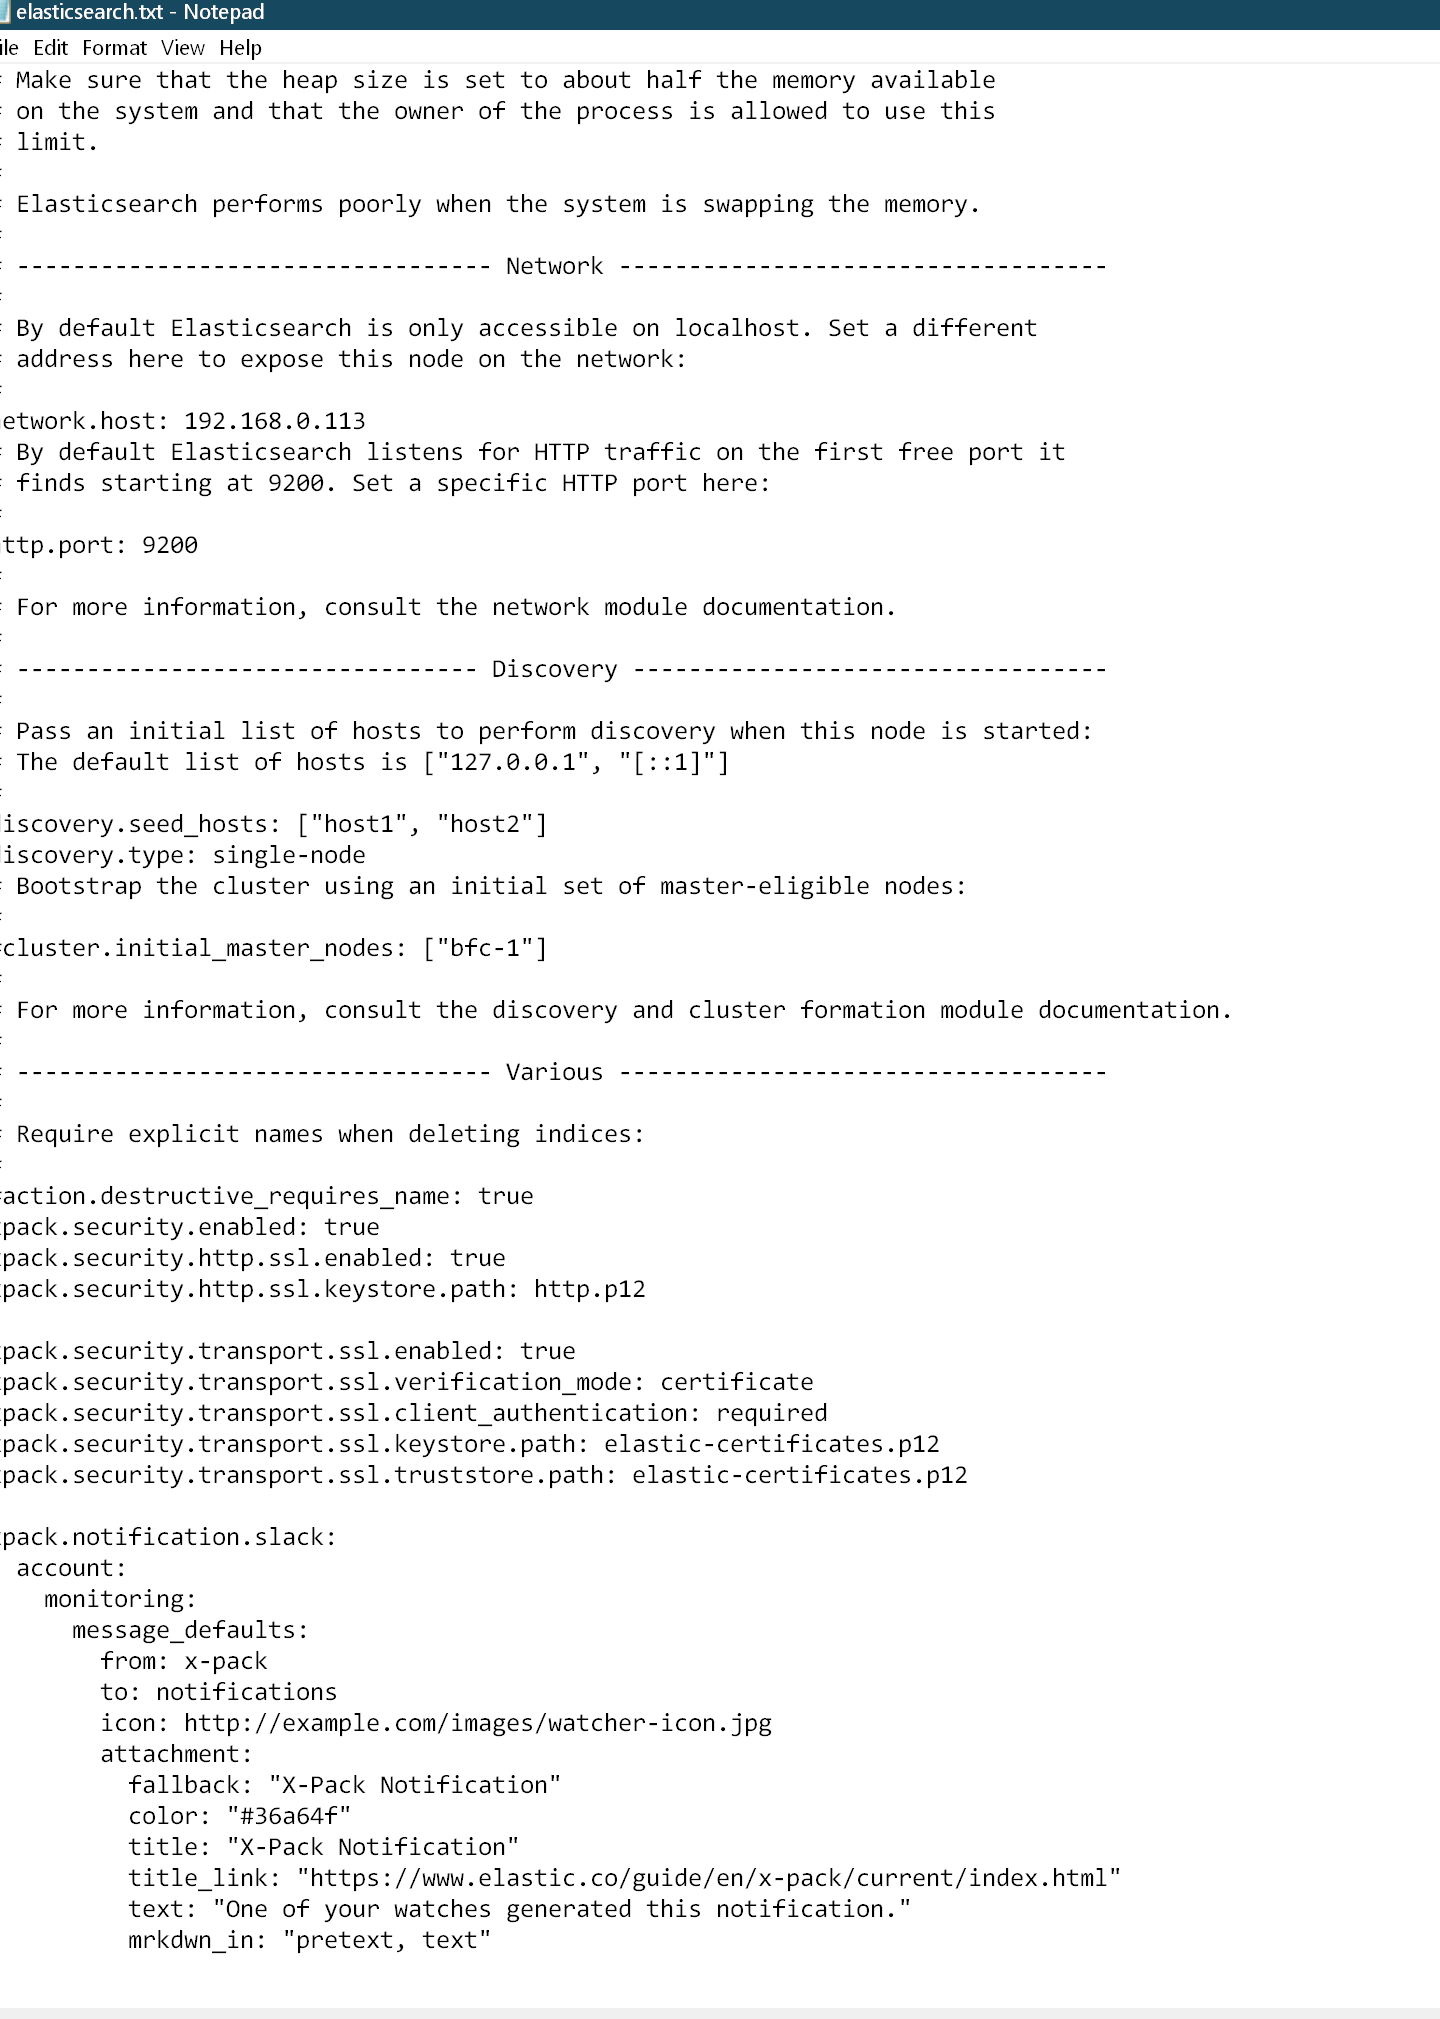
I see, sorry for that, please find es.yml as below. Thank you so much
# ======================== Elasticsearch Configuration =========================
#
# NOTE: Elasticsearch comes with reasonable defaults for most settings.
#       Before you set out to tweak and tune the configuration, make sure you
#       understand what are you trying to accomplish and the consequences.
#
# The primary way of configuring a node is via this file. This template lists
# the most important settings you may want to configure for a production cluster.
#
# Please consult the documentation for further information on configuration options:
# https://www.elastic.co/guide/en/elasticsearch/reference/index.html
#
# ---------------------------------- Cluster -----------------------------------
#
# Use a descriptive name for your cluster:
#
cluster.name: bfc_app
#
# ------------------------------------ Node ------------------------------------
#
# Use a descriptive name for the node:
#
node.name: bfc-2
#
# Add custom attributes to the node:
#
#node.attr.rack: r1
#
# ----------------------------------- Paths ------------------------------------
#
# Path to directory where to store the data (separate multiple locations by comma):
#
path.data: /var/lib/elasticsearch
path.repo: /home/dat/backup_kibana
# Path to log files:
#
path.logs: /var/log/elasticsearch
#
# ----------------------------------- Memory -----------------------------------
#
# Lock the memory on startup:
#
bootstrap.memory_lock: true
#
# Make sure that the heap size is set to about half the memory available
# on the system and that the owner of the process is allowed to use this
# limit.
#
# Elasticsearch performs poorly when the system is swapping the memory.
#
# ---------------------------------- Network -----------------------------------
#
# By default Elasticsearch is only accessible on localhost. Set a different
# address here to expose this node on the network:
#
network.host: 192.168.0.113
# By default Elasticsearch listens for HTTP traffic on the first free port it
# finds starting at 9200. Set a specific HTTP port here:
#
http.port: 9200
#
# For more information, consult the network module documentation.
#
# --------------------------------- Discovery ----------------------------------
#
# Pass an initial list of hosts to perform discovery when this node is started:
# The default list of hosts is ["127.0.0.1", "[::1]"]
#
discovery.seed_hosts: ["host1", "host2"]
discovery.type: single-node
# Bootstrap the cluster using an initial set of master-eligible nodes:
#
#cluster.initial_master_nodes: ["bfc-1"]
#
# For more information, consult the discovery and cluster formation module documentation.
#
# ---------------------------------- Various -----------------------------------
#
# Require explicit names when deleting indices:
#
#action.destructive_requires_name: true
xpack.security.enabled: true
xpack.security.http.ssl.enabled: true
xpack.security.http.ssl.keystore.path: http.p12

xpack.security.transport.ssl.enabled: true
xpack.security.transport.ssl.verification_mode: certificate
xpack.security.transport.ssl.client_authentication: required
xpack.security.transport.ssl.keystore.path: elastic-certificates.p12
xpack.security.transport.ssl.truststore.path: elastic-certificates.p12

xpack.notification.slack:
  account:
    monitoring:
      message_defaults:
        from: x-pack
        to: notifications
        icon: http://example.com/images/watcher-icon.jpg
        attachment:
          fallback: "X-Pack Notification"
          color: "#36a64f"
          title: "X-Pack Notification"
          title_link: "https://www.elastic.co/guide/en/x-pack/current/index.html"
          text: "One of your watches generated this notification."
          mrkdwn_in: "pretext, text"
Comment out
as well as
and see if you can startup elasticsearch without any errors first.
Done, and start up es w/o errors
#
# For more information, consult the network module documentation.
#
# --------------------------------- Discovery ----------------------------------
#
# Pass an initial list of hosts to perform discovery when this node is started:
# The default list of hosts is ["127.0.0.1", "[::1]"]
#
#discovery.seed_hosts: ["host1", "host2"]
discovery.type: single-node
# Bootstrap the cluster using an initial set of master-eligible nodes:
#
#cluster.initial_master_nodes: ["bfc-1"]
#
# For more information, consult the discovery and cluster formation module documentation.
#
# ---------------------------------- Various -----------------------------------
#
# Require explicit names when deleting indices:
#
#action.destructive_requires_name: true
#xpack.security.enabled: true
xpack.security.http.ssl.enabled: true
xpack.security.http.ssl.keystore.path: http.p12

#xpack.security.transport.ssl.enabled: true
xpack.security.transport.ssl.verification_mode: certificate
xpack.security.transport.ssl.client_authentication: required
xpack.security.transport.ssl.keystore.path: elastic-certificates.p12
xpack.security.transport.ssl.truststore.path: elastic-certificates.p12

xpack.notification.slack:
  account:
    monitoring:
      message_defaults:
        from: x-pack
        to: notifications
        icon: http://example.com/images/watcher-icon.jpg
        attachment:
          fallback: "X-Pack Notification"
          color: "#36a64f"
          title: "X-Pack Notification"
          title_link: "https://www.elastic.co/guide/en/x-pack/current/index.html"
          text: "One of your watches generated this notification."
          mrkdwn_in: "pretext, text"

I would review the TLS / SSL setup and enabled it.
If you restart everything works, you can enable http, if required and see if there is where the problem lies.
With the basic current security, you should be able start Kibana and see if you can move pass the initial error.
Also check your indices are all OK.
curl -X GET "http://:9200/_cluster/health?pretty"
There is still same problem wiht kibana server although I've changed es to basic security, and es indices es are okay. I attached some last kibana logs.

{
{"type":"log","@timestamp":"2021-11-07T22:53:43+07:00","tags":["info","savedobjects-service"],"pid":25285,"message":"[.kibana_task_manager] OUTDATED_DOCUMENTS_SEARCH_OPEN_PIT -> OUTDATED_DOCUMENTS_SEARCH_OPEN_PIT. took: 16187ms."}
{"type":"log","@timestamp":"2021-11-07T22:53:43+07:00","tags":["error","savedobjects-service"],"pid":25285,"message":"[.kibana] Action failed with 'search_phase_execution_exception: '. Retrying attempt 5 in 32 seconds."}
{"type":"log","@timestamp":"2021-11-07T22:53:43+07:00","tags":["info","savedobjects-service"],"pid":25285,"message":"[.kibana] OUTDATED_DOCUMENTS_SEARCH_OPEN_PIT -> OUTDATED_DOCUMENTS_SEARCH_OPEN_PIT. took: 16192ms."}
{"type":"log","@timestamp":"2021-11-07T22:53:46+07:00","tags":["warning","plugins-system","standard"],"pid":25285,"message":"\"eventLog\" plugin didn't stop in 30sec., move on to the next."}
{"type":"log","@timestamp":"2021-11-07T22:53:53+07:00","tags":["info","plugins-service"],"pid":27544,"message":"Plugin \"metricsEntities\" is disabled."}
{"type":"log","@timestamp":"2021-11-07T22:53:53+07:00","tags":["info","http","server","Preboot"],"pid":27544,"message":"http server running at https://192.168.0.113:5601"}
{"type":"log","@timestamp":"2021-11-07T22:53:53+07:00","tags":["warning","config","deprecation"],"pid":27544,"message":"\"logging.dest\" has been deprecated and will be removed in 8.0. To set the destination moving forward, you can use the \"console\" appender in your logging configuration or define a custom one. For more details, see https://github.com/elastic/kibana/blob/master/src/core/server/logging/README.mdx"}
{"type":"log","@timestamp":"2021-11-07T22:53:53+07:00","tags":["warning","config","deprecation"],"pid":27544,"message":"plugins.scanDirs is deprecated and is no longer used"}
{"type":"log","@timestamp":"2021-11-07T22:53:53+07:00","tags":["warning","config","deprecation"],"pid":27544,"message":"Config key [monitoring.cluster_alerts.email_notifications.email_address] will be required for email notifications to work in 8.0.\""}
{"type":"log","@timestamp":"2021-11-07T22:53:53+07:00","tags":["warning","config","deprecation"],"pid":27544,"message":"\"xpack.reporting.roles\" is deprecated. Granting reporting privilege through a \"reporting_user\" role will not be supported starting in 8.0. Please set \"xpack.reporting.roles.enabled\" to \"false\" and grant reporting privileges to users using Kibana application privileges **Management > Security > Roles**."}
{"type":"log","@timestamp":"2021-11-07T22:53:53+07:00","tags":["info","plugins-system","standard"],"pid":27544,"message":"Setting up [113] plugins: [translations,licensing,globalSearch,globalSearchProviders,banners,licenseApiGuard,code,usageCollection,xpackLegacy,taskManager,telemetryCollectionManager,telemetryCollectionXpack,kibanaUsageCollection,securityOss,share,screenshotMode,telemetry,newsfeed,mapsEms,mapsLegacy,legacyExport,kibanaLegacy,embeddable,uiActionsEnhanced,fieldFormats,expressions,charts,esUiShared,bfetch,data,savedObjects,visualizations,visTypeXy,visTypeVislib,visTypeTimelion,features,visTypeTagcloud,visTypeTable,visTypePie,visTypeMetric,visTypeMarkdown,tileMap,regionMap,presentationUtil,expressionShape,expressionRevealImage,expressionRepeatImage,expressionMetric,expressionImage,timelion,indexPatternFieldEditor,home,searchprofiler,painlessLab,grokdebugger,graph,visTypeVega,management,watcher,licenseManagement,indexPatternManagement,advancedSettings,discover,discoverEnhanced,dashboard,dashboardEnhanced,visualize,visTypeTimeseries,savedObjectsManagement,spaces,security,transform,savedObjectsTagging,lens,reporting,canvas,lists,ingestPipelines,fileUpload,maps,dataVisualizer,encryptedSavedObjects,dataEnhanced,dashboardMode,cloud,snapshotRestore,fleet,indexManagement,rollup,remoteClusters,crossClusterReplication,indexLifecycleManagement,eventLog,actions,alerting,triggersActionsUi,stackAlerts,ruleRegistry,osquery,ml,cases,timelines,securitySolution,observability,uptime,infra,upgradeAssistant,monitoring,logstash,enterpriseSearch,console,apmOss,apm]"}
{"type":"log","@timestamp":"2021-11-07T22:53:53+07:00","tags":["info","plugins","taskManager"],"pid":27544,"message":"TaskManager is identified by the Kibana UUID: a8408399-f95e-4a63-b8ea-e1b576512c07"}
{"type":"log","@timestamp":"2021-11-07T22:53:53+07:00","tags":["warning","plugins","reporting","config"],"pid":27544,"message":"Generating a random key for xpack.reporting.encryptionKey. To prevent sessions from being invalidated on restart, please set xpack.reporting.encryptionKey in the kibana.yml or use the bin/kibana-encryption-keys command."}
{"type":"log","@timestamp":"2021-11-07T22:53:53+07:00","tags":["info","plugins","reporting","config"],"pid":27544,"message":"Chromium sandbox provides an additional layer of protection, and is supported for Linux Ubuntu 20.04 OS. Automatically enabling Chromium sandbox."}
{"type":"log","@timestamp":"2021-11-07T22:53:54+07:00","tags":["info","plugins","ruleRegistry"],"pid":27544,"message":"Write is disabled; not installing common resources shared between all indices"}
{"type":"log","@timestamp":"2021-11-07T22:53:54+07:00","tags":["info","plugins","ruleRegistry"],"pid":27544,"message":"Write is disabled; not installing resources for index .alerts-observability.uptime.alerts"}
{"type":"log","@timestamp":"2021-11-07T22:53:54+07:00","tags":["info","plugins","ruleRegistry"],"pid":27544,"message":"Write is disabled; not installing resources for index .alerts-observability.logs.alerts"}
{"type":"log","@timestamp":"2021-11-07T22:53:54+07:00","tags":["info","plugins","ruleRegistry"],"pid":27544,"message":"Write is disabled; not installing resources for index .alerts-observability.metrics.alerts"}
{"type":"log","@timestamp":"2021-11-07T22:53:54+07:00","tags":["info","plugins","ruleRegistry"],"pid":27544,"message":"Write is disabled; not installing resources for index .alerts-observability.apm.alerts"}
{"type":"log","@timestamp":"2021-11-07T22:53:54+07:00","tags":["info","savedobjects-service"],"pid":27544,"message":"Waiting until all Elasticsearch nodes are compatible with Kibana before starting saved objects migrations..."}
{"type":"log","@timestamp":"2021-11-07T22:53:54+07:00","tags":["info","savedobjects-service"],"pid":27544,"message":"Starting saved objects migrations"}
{"type":"log","@timestamp":"2021-11-07T22:53:54+07:00","tags":["info","savedobjects-service"],"pid":27544,"message":"[.kibana] INIT -> OUTDATED_DOCUMENTS_SEARCH_OPEN_PIT. took: 61ms."}
{"type":"log","@timestamp":"2021-11-07T22:53:54+07:00","tags":["info","savedobjects-service"],"pid":27544,"message":"[.kibana_task_manager] INIT -> OUTDATED_DOCUMENTS_SEARCH_OPEN_PIT. took: 176ms."}
{"type":"log","@timestamp":"2021-11-07T22:53:54+07:00","tags":["error","savedobjects-service"],"pid":27544,"message":"[.kibana] Action failed with 'search_phase_execution_exception: '. Retrying attempt 1 in 2 seconds."}
{"type":"log","@timestamp":"2021-11-07T22:53:54+07:00","tags":["info","savedobjects-service"],"pid":27544,"message":"[.kibana] OUTDATED_DOCUMENTS_SEARCH_OPEN_PIT -> OUTDATED_DOCUMENTS_SEARCH_OPEN_PIT. took: 489ms."}
{"type":"log","@timestamp":"2021-11-07T22:53:54+07:00","tags":["error","savedobjects-service"],"pid":27544,"message":"[.kibana_task_manager] Action failed with 'search_phase_execution_exception: '. Retrying attempt 1 in 2 seconds."}
{"type":"log","@timestamp":"2021-11-07T22:53:54+07:00","tags":["info","savedobjects-service"],"pid":27544,"message":"[.kibana_task_manager] OUTDATED_DOCUMENTS_SEARCH_OPEN_PIT -> OUTDATED_DOCUMENTS_SEARCH_OPEN_PIT. took: 373ms."}
{"type":"log","@timestamp":"2021-11-07T22:53:56+07:00","tags":["error","savedobjects-service"],"pid":27544,"message":"[.kibana_task_manager] Action failed with 'search_phase_execution_exception: '. Retrying attempt 2 in 4 seconds."}
{"type":"log","@timestamp":"2021-11-07T22:53:56+07:00","tags":["info","savedobjects-service"],"pid":27544,"message":"[.kibana_task_manager] OUTDATED_DOCUMENTS_SEARCH_OPEN_PIT -> OUTDATED_DOCUMENTS_SEARCH_OPEN_PIT. took: 2014ms."}
{"type":"log","@timestamp":"2021-11-07T22:53:56+07:00","tags":["error","savedobjects-service"],"pid":27544,"message":"[.kibana] Action failed with 'search_phase_execution_exception: '. Retrying attempt 2 in 4 seconds."}
{"type":"log","@timestamp":"2021-11-07T22:53:56+07:00","tags":["info","savedobjects-service"],"pid":27544,"message":"[.kibana] OUTDATED_DOCUMENTS_SEARCH_OPEN_PIT -> OUTDATED_DOCUMENTS_SEARCH_OPEN_PIT. took: 2016ms."}
{"type":"log","@timestamp":"2021-11-07T22:54:00+07:00","tags":["error","savedobjects-service"],"pid":27544,"message":"[.kibana_task_manager] Action failed with 'search_phase_execution_exception: '. Retrying attempt 3 in 8 seconds."}
{"type":"log","@timestamp":"2021-11-07T22:54:00+07:00","tags":["info","savedobjects-service"],"pid":27544,"message":"[.kibana_task_manager] OUTDATED_DOCUMENTS_SEARCH_OPEN_PIT -> OUTDATED_DOCUMENTS_SEARCH_OPEN_PIT. took: 4015ms."}
{"type":"log","@timestamp":"2021-11-07T22:54:00+07:00","tags":["error","savedobjects-service"],"pid":27544,"message":"[.kibana] Action failed with 'search_phase_execution_exception: '. Retrying attempt 3 in 8 seconds."}
{"type":"log","@timestamp":"2021-11-07T22:54:00+07:00","tags":["info","savedobjects-service"],"pid":27544,"message":"[.kibana] OUTDATED_DOCUMENTS_SEARCH_OPEN_PIT -> OUTDATED_DOCUMENTS_SEARCH_OPEN_PIT. took: 4016ms."}
{"type":"log","@timestamp":"2021-11-07T22:54:08+07:00","tags":["error","savedobjects-service"],"pid":27544,"message":"[.kibana_task_manager] Action failed with 'search_phase_execution_exception: '. Retrying attempt 4 in 16 seconds."}
{"type":"log","@timestamp":"2021-11-07T22:54:08+07:00","tags":["info","savedobjects-service"],"pid":27544,"message":"[.kibana_task_manager] OUTDATED_DOCUMENTS_SEARCH_OPEN_PIT -> OUTDATED_DOCUMENTS_SEARCH_OPEN_PIT. took: 8015ms."}
{"type":"log","@timestamp":"2021-11-07T22:54:08+07:00","tags":["error","savedobjects-service"],"pid":27544,"message":"[.kibana] Action failed with 'search_phase_execution_exception: '. Retrying attempt 4 in 16 seconds."}
{"type":"log","@timestamp":"2021-11-07T22:54:08+07:00","tags":["info","savedobjects-service"],"pid":27544,"message":"[.kibana] OUTDATED_DOCUMENTS_SEARCH_OPEN_PIT -> OUTDATED_DOCUMENTS_SEARCH_OPEN_PIT. took: 8016ms."}
{"type":"log","@timestamp":"2021-11-07T22:54:25+07:00","tags":["error","savedobjects-service"],"pid":27544,"message":"[.kibana] Action failed with 'search_phase_execution_exception: '. Retrying attempt 5 in 32 seconds."}
{"type":"log","@timestamp":"2021-11-07T22:54:25+07:00","tags":["info","savedobjects-service"],"pid":27544,"message":"[.kibana] OUTDATED_DOCUMENTS_SEARCH_OPEN_PIT -> OUTDATED_DOCUMENTS_SEARCH_OPEN_PIT. took: 16260ms."}
{"type":"log","@timestamp":"2021-11-07T22:54:25+07:00","tags":["error","savedobjects-service"],"pid":27544,"message":"[.kibana_task_manager] Action failed with 'search_phase_execution_exception: '. Retrying attempt 5 in 32 seconds."}
{"type":"log","@timestamp":"2021-11-07T22:54:25+07:00","tags":["info","savedobjects-service"],"pid":27544,"message":"[.kibana_task_manager] OUTDATED_DOCUMENTS_SEARCH_OPEN_PIT -> OUTDATED_DOCUMENTS_SEARCH_OPEN_PIT. took: 16268ms."}
{"type":"log","@timestamp":"2021-11-07T22:54:57+07:00","tags":["error","savedobjects-service"],"pid":27544,"message":"[.kibana] Action failed with 'search_phase_execution_exception: '. Retrying attempt 6 in 64 seconds."}
{"type":"log","@timestamp":"2021-11-07T22:54:57+07:00","tags":["info","savedobjects-service"],"pid":27544,"message":"[.kibana] OUTDATED_DOCUMENTS_SEARCH_OPEN_PIT -> OUTDATED_DOCUMENTS_SEARCH_OPEN_PIT. took: 32016ms."}
{"type":"log","@timestamp":"2021-11-07T22:54:57+07:00","tags":["error","savedobjects-service"],"pid":27544,"message":"[.kibana_task_manager] Action failed with 'search_phase_execution_exception: '. Retrying attempt 6 in 64 seconds."}
{"type":"log","@timestamp":"2021-11-07T22:54:57+07:00","tags":["info","savedobjects-service"],"pid":27544,"message":"[.kibana_task_manager] OUTDATED_DOCUMENTS_SEARCH_OPEN_PIT -> OUTDATED_DOCUMENTS_SEARCH_OPEN_PIT. took: 32014ms."}
and here is the kibana.yml
# Kibana is served by a back end server. This setting specifies the port to use
server.port: 5601

# Specifies the address to which the Kibana server will bind. IP addresses and host names are both valid values.
# The default is 'localhost', which usually means remote machines will not be able to connect.
# To allow connections from remote users, set this parameter to a non-loopback address.
server.host: "192.168.0.113"

# Enables you to specify a path to mount Kibana at if you are running behind a proxy.
# Use the `server.rewriteBasePath` setting to tell Kibana if it should remove the basePath
# from requests it receives, and to prevent a deprecation warning at startup.
# This setting cannot end in a slash.
#server.basePath: "192.168.0.113"

# Specifies whether Kibana should rewrite requests that are prefixed with
# `server.basePath` or require that they are rewritten by your reverse proxy.
# This setting was effectively always `false` before Kibana 6.3 and will
# default to `true` starting in Kibana 7.0.
#server.rewriteBasePath: false

# Specifies the public URL at which Kibana is available for end users. If
# `server.basePath` is configured this URL should end with the same basePath.
#server.publicBaseUrl: "https://192.168.0.113:5601"

# The maximum payload size in bytes for incoming server requests.
#server.maxPayload: 1048576

# The Kibana server's name.  This is used for display purposes.
#server.name: "your-hostname"

# The URLs of the Elasticsearch instances to use for all your queries.
elasticsearch.hosts: ["http://192.168.0.113:9200"]

# Kibana uses an index in Elasticsearch to store saved searches, visualizations and
# dashboards. Kibana creates a new index if the index doesn't already exist.
#kibana.index: ".kibana"

# The default application to load.
#kibana.defaultAppId: "home"

# If your Elasticsearch is protected with basic authentication, these settings provide
# the username and password that the Kibana server uses to perform maintenance on the Kibana
# index at startup. Your Kibana users still need to authenticate with Elasticsearch, which
# is proxied through the Kibana server.
elasticsearch.username: "kibana_system"
elasticsearch.password: "dat12345"

# Kibana can also authenticate to Elasticsearch via "service account tokens".
# If may use this token instead of a username/password.
# elasticsearch.serviceAccountToken: "my_token"

# Enables SSL and paths to the PEM-format SSL certificate and SSL key files, respectively.
# These settings enable SSL for outgoing requests from the Kibana server to the browser.
server.ssl.enabled: true
server.ssl.certificate: /etc/kibana/192.168.0.113.crt
server.ssl.key: /etc/kibana/192.168.0.113.key
Your Elasticsearch cluster is Red.
It should be Green (or at least Yellow) to proceed.
Probably need to set your replicas to "0" or check the unassigned indices.
Set replicas to 0
curl -XPUT 'http://<IP Address>:9200/_all/_settings?preserve_existing=true' -H 'Content-Type: application/json' -u user:password -d '{
  "index.number_of_replicas" : "0",
  "index.number_of_shards" : "1"
}'
I've tried:
curl -XPUT 'http://192.168.0.113:9200/_all/_settings?preserve_existing=true' -H 'Content-Type: application/json' -u dat:dat12345 -d '{
"index.number_of_replicas" : "0",
"index.number_of_shards" : "1"
}'
but there are and errors occurred
{"error":{"root_cause":[{"type":"illegal_argument_exception","reason":"Can't update non dynamic settings [[index.number_of_shards]] for open indices [[.fleet-servers-7/_Mkg_mvOSfOlTY3Pipf8vw], [.security-7/z4_cx0hlSc2A1L3vleW1BA], [.ml-inference-000003/v2ldEp10SbSFF0Bk8f4wWQ], [.kibana_7.15.0_001/1RuGVi9lRnKxY1PjWy6GnA], [.ds-metrics-elastic_agent.elastic_agent-default-2021.10.25-000001/n49AtcYrSwOQ3HjrsaTn3w], [.tasks/W3Cfnt2SQmW56zniCxoKEA], [.monitoring-es-7-2021.10.29/aX6OvKXmTdafZ7ld_GKmaA], [.ml-config/Kx9JMkMPTVGy-sQ5eOO-eg], [.ds-logs-elastic_agent.fleet_server-default-2021.11.01-000002/wYbheU2JTW2rzOlZlDPlgA], [bfctnc530-datasets-2021-11-06/7PYYj3loSu-XBB7AkfSzlg], [.fleet-agents-7/UfXLdakaQ2SixiRbM1CjiQ], [.transform-internal-007/GFF_6C5UROCi_YpPgo3r1A], [.async-search/mOuWjR6eQju5mtkLGL82lA], [.lists-default-000001/O0llOFvhQkGfbGLuLp4MLQ], [.monitoring-kibana-7-2021.10.30/iA4FoTorSJST6SZv3iZvig], [.fleet-enrollment-api-keys-7/TuOLWjfIQWCr-Ayb63vQfg], [.monitoring-kibana-7-2021.11.06/a-FLx9W5RvOn7Yse3MjTqg], [.kibana-event-log-7.15.1/E3uAXkBoQgS1GrJF48tW2w], [.ds-metrics-elastic_agent.fleet_server-default-2021.10.25-000001/ReoAooeMTjm6_LpnH5d6Jg], [.reporting-2021-10-24/fKm14kZKTyilUjRnnQGZsQ], [.kibana_task_manager_7.15.0_001/iz455zcLQw-L8_ysJL5-vg], [.monitoring-es-7-2021.11.03/T-FoUpNjT3avuZLsauk81g], [.kibana_7.15.1_001/A4VAkPqBRFehP4g2rtI49Q], [.monitoring-es-7-2021.11.07/OScczrlXTjSi23Q2YjeEyg], [.ds-logs-elastic_agent-default-2021.11.01-000002/NKwWDV5_RAuP-9VmzlgDeA], [.fleet-policies-leader-7/CfV8nWi0SCCrEy481_JfxQ], [.fleet-policies-7/NCP8FiysSSyfNefRN3iTMg], [.monitoring-kibana-7-2021.10.29/9NzbjN37TZu2dSpYlQfPzg], [.monitoring-kibana-7-2021.10.31/Nb9A6ahmT8iAYayvjOXAFw], [.watches/k4O05BP9QNSVS0aIZKfp9A], [.monitoring-alerts-7/A9GisYCRRmWtZQ8De3f2eg], [.monitoring-es-7-2021.11.06/v0S_1gVNSnu7mCNECLvBYg], [.kibana_task_manager_7.15.1_001/JhTJQV4DREe4uaFPw6hUIA], [.apm-custom-link/DmGeLIlaQ8e6m2rxIvD3qQ], [my-location/efMB65BLSlOicQEeuKkWLQ], [.ds-logs-elastic_agent.fleet_server-default-2021.10.25-000001/mBdVG40CRJ-fEfOtKaBoBA], [.monitoring-kibana-7-2021.11.01/QkckD9lgQvW2PeePJfFGLw], [index/M2_DtQQmRKuS5fOc67avPw], [.apm-agent-configuration/ta2BjJlGTVayOENxsvLbaw], [.monitoring-es-7-2021.11.02/0zLiM88sRee-Sr0K_fdaXQ], [.monitoring-kibana-7-2021.11.03/P22HIpfTTVOa6-lZ7qAPZw], [.triggered_watches/QCkLAoUVTDq7YeeCpt7cgg], [.monitoring-es-7-2021.11.01/EDMitEEvSKSp6MgTeaFa2A], [.monitoring-kibana-7-2021.11.05/qIIebxx9SiKmmUOy68Z4IQ], [.monitoring-kibana-7-2021.11.02/4Oc11sqPS160e3_gvmX28w]]"}],"type":"illegal_argument_exception","reason":"Can't update non dynamic settings [[index.number_of_shards]] for open indices [[.fleet-servers-7/_Mkg_mvOSfOlTY3Pipf8vw], [.security-7/z4_cx0hlSc2A1L3vleW1BA], [.ml-inference-000003/v2ldEp10SbSFF0Bk8f4wWQ], [.kibana_7.15.0_001/1RuGVi9lRnKxY1PjWy6GnA], [.ds-metrics-elastic_agent.elastic_agent-default-2021.10.25-000001/n49AtcYrSwOQ3HjrsaTn3w], [.tasks/W3Cfnt2SQmW56zniCxoKEA], [.monitoring-es-7-2021.10.29/aX6OvKXmTdafZ7ld_GKmaA], [.ml-config/Kx9JMkMPTVGy-sQ5eOO-eg], [.ds-logs-elastic_agent.fleet_server-default-2021.11.01-000002/wYbheU2JTW2rzOlZlDPlgA], [bfctnc530-datasets-2021-11-06/7PYYj3loSu-XBB7AkfSzlg], [.fleet-agents-7/UfXLdakaQ2SixiRbM1CjiQ], [.transform-internal-007/GFF_6C5UROCi_YpPgo3r1A], [.async-search/mOuWjR6eQju5mtkLGL82lA], [.lists-default-000001/O0llOFvhQkGfbGLuLp4MLQ], [.monitoring-kibana-7-2021.10.30/iA4FoTorSJST6SZv3iZvig], [.fleet-enrollment-api-keys-7/TuOLWjfIQWCr-Ayb63vQfg], [.monitoring-kibana-7-2021.11.06/a-FLx9W5RvOn7Yse3MjTqg], [.kibana-event-log-7.15.1/E3uAXkBoQgS1GrJF48tW2w], [.ds-metrics-elastic_agent.fleet_server-default-2021.10.25-000001/ReoAooeMTjm6_LpnH5d6Jg], [.reporting-2021-10-24/fKm14kZKTyilUjRnnQGZsQ], [.kibana_task_manager_7.15.0_001/iz455zcLQw-L8_ysJL5-vg], [.monitoring-es-7-2021.11.03/T-FoUpNjT3avuZLsauk81g], [.kibana_7.15.1_001/A4VAkPqBRFehP4g2rtI49Q], [.monitoring-es-7-2021.11.07/OScczrlXTjSi23Q2YjeEyg], [.ds-logs-elastic_agent-default-2021.11.01-000002/NKwWDV5_RAuP-9VmzlgDeA], [.fleet-policies-leader-7/CfV8nWi0SCCrEy481_JfxQ], [.fleet-policies-7/NCP8FiysSSyfNefRN3iTMg], [.monitoring-kibana-7-2021.10.29/9NzbjN37TZu2dSpYlQfPzg], [.monitoring-kibana-7-2021.10.31/Nb9A6ahmT8iAYayvjOXAFw], [.watches/k4O05BP9QNSVS0aIZKfp9A], [.monitoring-alerts-7/A9GisYCRRmWtZQ8De3f2eg], [.monitoring-es-7-2021.11.06/v0S_1gVNSnu7mCNECLvBYg], [.kibana_task_manager_7.15.1_001/JhTJQV4DREe4uaFPw6hUIA], [.apm-custom-link/DmGeLIlaQ8e6m2rxIvD3qQ], [my-location/efMB65BLSlOicQEeuKkWLQ], [.ds-logs-elastic_agent.fleet_server-default-2021.10.25-000001/mBdVG40CRJ-fEfOtKaBoBA], [.monitoring-kibana-7-2021.11.01/QkckD9lgQvW2PeePJfFGLw], [index/M2_DtQQmRKuS5fOc67avPw], [.apm-agent-configuration/ta2BjJlGTVayOENxsvLbaw], [.monitoring-es-7-2021.11.02/0zLiM88sRee-Sr0K_fdaXQ], [.monitoring-kibana-7-2021.11.03/P22HIpfTTVOa6-lZ7qAPZw], [.triggered_watches/QCkLAoUVTDq7YeeCpt7cgg], [.monitoring-es-7-2021.11.01/EDMitEEvSKSp6MgTeaFa2A], [.monitoring-kibana-7-2021.11.05/qIIebxx9SiKmmUOy68Z4IQ], [.monitoring-kibana-7-2021.11.02/4Oc11sqPS160e3_gvmX28w]]"},"status":400}root@dat:~#
Identify and fix the indices causing your Cluster Health to show Red.
curl -XGET http://<ip address>:9200/_cat/shards?h=index,shard,prirep,state,unassigned.reason| grep UNASSIGNED
Hi zx8086,
The problem solved when I decided to remove es and reinstall it.
Thank you so much for your generous support.