Wylie,
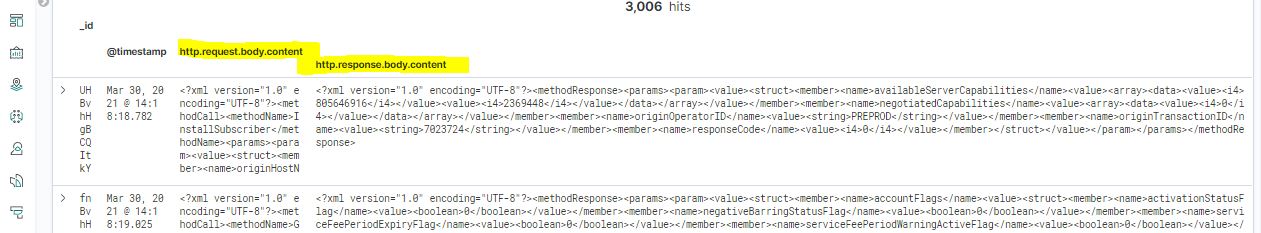
Follow bellow Json/printscreen for each ES+Kibana Version
- Version 7.6:
{
"_index": "packetbeat-ecms-7.6.1-2021-03-30",
"_type": "_doc",
"_id": "qX5whHgBCQItkYpAQjQn",
"_version": 1,
"_score": 0,
"_source": {
"@timestamp": "2021-03-30T17:19:10.807Z",
"url": {
"port": 10115,
"path": "/Air",
"full": "http://10.110.181.143:10115/Air",
"scheme": "http",
"domain": "10.110.181.143"
},
"server": {
"port": 10115,
"bytes": 9322,
"ip": "10.110.181.143"
},
"event": {
"dataset": "http",
"duration": 8801000,
"start": "2021-03-30T17:19:10.807Z",
"end": "2021-03-30T17:19:10.816Z",
"kind": "event",
"category": "network_traffic"
},
"query": "POST /Air",
"client": {
"ip": "10.110.181.9",
"port": 21299,
"bytes": 1212
},
"type": "http",
"destination": {
"port": 10115,
"bytes": 9322,
"ip": "10.110.181.143"
},
"ecs": {
"version": "1.4.0"
},
"host": {
"name": "ecmsdb2sm2"
},
"http": {
"request": {
"bytes": 1212,
"headers": {
"content-type": "text/xml",
"content-length": 971
},
"method": "post",
"body": {
"content": "<?xml version=\"1.0\" encoding=\"UTF-8\"?>GetAccountDetailsoriginHostNameCMAoriginTimeStamp<dateTime.iso8601>20210330T14:19:10-0300</dateTime.iso8601>originNodeTypeADMrequestedInformationFlagsrequestMasterAccountBalanceFlag1originTransactionID8437521subscriberNumber5511947069252subscriberNumberNAI1negotiatedCapabilities",
"bytes": 971
}
},
"response": {
"status_phrase": "ok",
"status_code": 200,
"body": {
"bytes": 9049,
"content": "<?xml version=\"1.0\" encoding=\"UTF-8\"?>accountFlagsactivationStatusFlag0ussdEndOfCallNotificationID255"
},
"bytes": 9322,
"headers": {
"content-length": 9049,
"content-type": "text/xml"
}
},
"version": "1.1"
},
"source": {
"ip": "10.110.181.9",
"port": 21299,
"bytes": 1212
},
"network": {
"protocol": "http",
"direction": "outbound",
"community_id": "1:wsZmwsJttSkfUR5QILDq8enTj+0=",
"bytes": 10534,
"type": "ipv4",
"transport": "tcp"
},
"status": "OK",
"method": "post",
"user_agent": {
"original": "CMA/5.0/2.0"
},
"agent": {
"ephemeral_id": "59af44e2-bc19-4312-9339-1e703b6a2204",
"hostname": "ecmsdb2sm2",
"id": "b753bd30-4d64-44b3-b942-488bc985186d",
"version": "7.6.1",
"type": "packetbeat"
}
},
"fields": {
"event.end": [
"2021-03-30T17:19:10.816Z"
],
"@timestamp": [
"2021-03-30T17:19:10.807Z"
],
"event.start": [
"2021-03-30T17:19:10.807Z"
]
},
"highlight": {
"network.protocol": [
"@kibana-highlighted-field@http@/kibana-highlighted-field@"
]
}
}
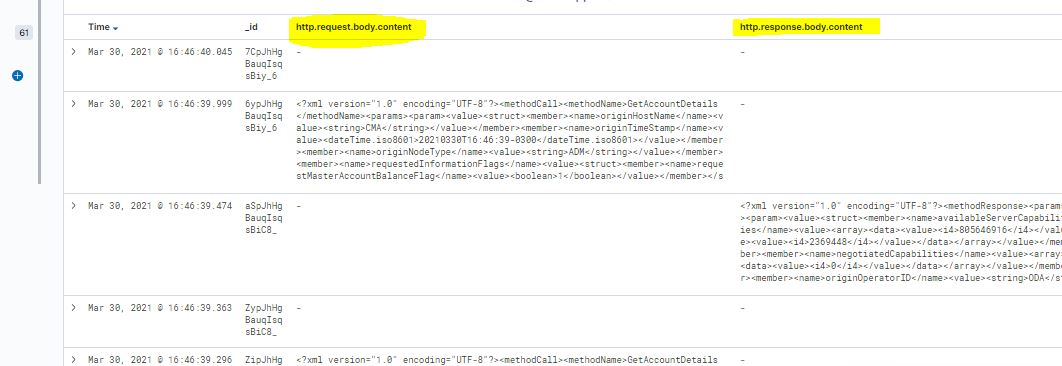
- Version 7.12
{
"_index": "packetbeat-ecms-7.6.1-2021-03-30",
"_type": "_doc",
"_id": "6ypJhHgBauqIsqsBiy_6",
"_version": 1,
"_score": null,
"fields": {
"event.category": [
"network_traffic"
],
"server.ip": [
"10.160.99.137"
],
"user_agent.original.text": [
"CMA/5.0/2.0"
],
"type": [
"http"
],
"http.request.method": [
"post"
],
"http.response.bytes": [
9322
],
"source.ip": [
"10.160.99.7"
],
"http.request.headers.content-length": [
971
],
"network.community_id": [
"1:K+ibSYSTdJNqb/nICgZBbY6SW6I="
],
"host.name": [
"ecms1df2"
],
"http.response.status_code": [
200
],
"http.version": [
"1.1"
],
"event.kind": [
"event"
],
"user_agent.original": [
"CMA/5.0/2.0"
],
"http.request.body.content.text": [
"<?xml version=\"1.0\" encoding=\"UTF-8\"?>GetAccountDetailsoriginHostNameCMAoriginTimeStamp<dateTime.iso8601>20210330T16:46:39-0300</dateTime.iso8601>originNodeTypeADMrequestedInformationFlagsrequestMasterAccountBalanceFlag1originTransactionID5955131subscriberNumber5562992714402subscriberNumberNAI1negotiatedCapabilities"
],
"method": [
"post"
],
"query": [
"POST /Air"
],
"client.ip": [
"10.160.99.7"
],
"agent.hostname": [
"ecms1df2"
],
"http.response.status_phrase": [
"ok"
],
"url.path": [
"/Air"
],
"source.port": [
47887
],
"agent.id": [
"94a8e0bc-b03e-4807-ba13-b8b81fd70083"
],
"bytes_out": [
9322
],
"client.port": [
47887
],
"ecs.version": [
"1.4.0"
],
"agent.version": [
"7.6.1"
],
"destination.bytes": [
9322
],
"event.start": [
"2021-03-30T19:46:39.999Z"
],
"status": [
"OK"
],
"server.bytes": [
9322
],
"http.request.body.bytes": [
971
],
"destination.port": [
10115
],
"bytes_in": [
1211
],
"event.end": [
"2021-03-30T19:46:40.039Z"
],
"url.scheme": [
"http"
],
"http.request.bytes": [
1211
],
"http.response.body.content.text": [
"<?xml version=\"1.0\" encoding=\"UTF-8\"?>accountFlagsactivationStatusFlag0negativeBarringStatusFlag0serviceFeePeriodExpiryFlag>
ps.: Due to huge size of http.response.body.content field, I had to cut some parts of it to give this reply.