Hi i've problem in SIEM/NETWORK/Flows i've just spinning ring and nothing displays , before update everything was fine.

and log https://pastebin.pl/view/88c362e3
i dont see nothing special here ;/ No idea how to fix it or where to search.
Hi i've problem in SIEM/NETWORK/Flows i've just spinning ring and nothing displays , before update everything was fine.
and log https://pastebin.pl/view/88c362e3
i dont see nothing special here ;/ No idea how to fix it or where to search.
Can you open up your developer tools of Chrome or whichever browser you're on and see if it has stack traces and JavaScript errors in it? Post those here. Looking through your log file attached I don't see anything that sticks out.
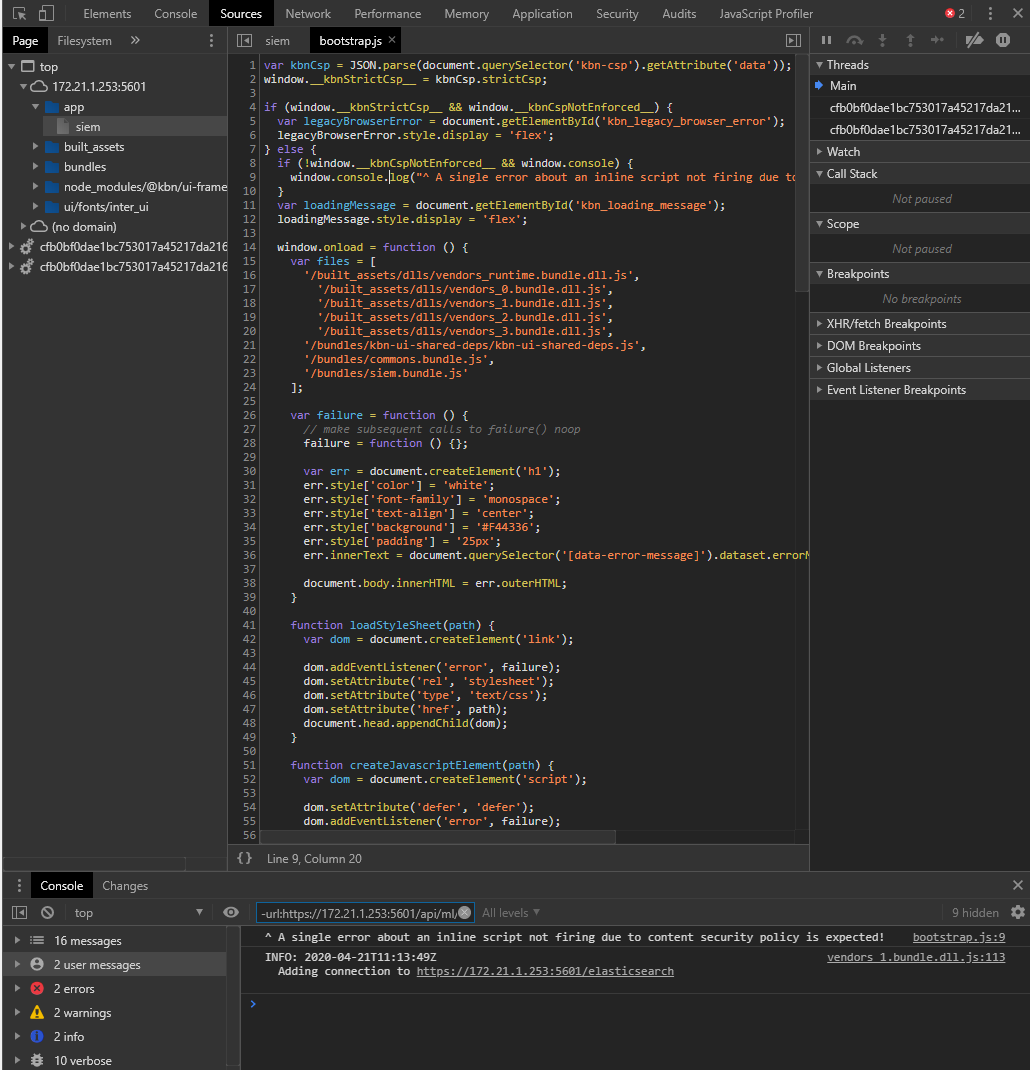
Sure. There is only
Refused to execute inline script because it violates the following Content Security Policy directive: "script-src 'unsafe-eval' 'self'". Either the 'unsafe-inline' keyword, a hash ('sha256-P5polb1UreUSOe5V/Pv7tc+yeZuJXiOi/3fqhGsU7BE='), or a nonce ('nonce-...') is required to enable inline execution.
Tried to google it but didint find nothing helpful
Tried in kibana.yml csp.strict: false/true
I've machine learning off , just using basic licence
Here's log if i click save in console brave https://pastebin.pl/view/d01d8d6a
Tried in edge / ff / brave / chrome
In firefox Content Security Policy: The page’s settings blocked the loading of a resource at inline (“script-src”).
Im using self signed SSL setup based on https://www.elastic.co/blog/configuring-ssl-tls-and-https-to-secure-elasticsearch-kibana-beats-and-logstash#enable-ts-logstash , it was working few updates before cant remember when it just broken up.
But this errors is on other tabs too but everything works fine, all siem options , dashboards etc. only network just spins.
The CSP errors are expected and normal and you should not turn it off as that would take away front end security checks that are important. That one console log line indicates that it is expected. If you look below that line you see an info that tells you, "This one error is ok because it's testing to ensure that CSP (Content Security Protection) is working You don't want to turn that off at all.
Looking through your server logs from earlier posts I see this error which is indicating that you are probably using a SSL certificate with an IP and not a host name which is self signed that is probably causing some issues (but might or might not be related to what you're seeing now)
{"type":"error","@timestamp":"2020-04-17T10:13:07Z","tags":["connection","client","error"],"pid":2732,"level":"error","error":{"message":"140381735438144:error:14094416:SSL routines:ssl3_read_bytes:sslv3 alert certificate unknown:../deps/openssl/openssl/ssl/record/rec_layer_s3.c:1544:SSL alert number 46n","name":"Error","stack":"Error: 140381735438144:error:14094416:SSL routines:ssl3_read_bytes:sslv3 alert certificate unknown:../deps/openssl/openssl/ssl/record/rec_layer_s3.c:1544:SSL alert number 46n"},"message":"140381735438144:error:14094416:SSL routines:ssl3_read_bytes:sslv3 alert certificate unknown:../deps/openssl/openssl/ssl/record/rec_layer_s3.c:1544:SSL alert number 46n"}
I can show you some switches below to clean up these errors but I have to caveat what I am saying by saying that I only approve of using properly signed Certificate Authorities (CA) with proper domain names within any organization. I won't go into details as usually this entails talking to your IT department or if you're a small organization coming up with your own tolerance level for security vs setup.
However, if you are using our system for testing or development and have self signed certificates that are tied to IP addresses and not trusted by a proper Certificate Authority you can circumvent these security checks with this line in your kibana.yml file for on prem installs:
elasticsearch.ssl.verificationMode: <you choose how insecure you want to be>
Ref:
https://www.elastic.co/guide/en/kibana/current/settings.html
I can't stress enough that messing with the verification mode should only be for test data and nothing sensitive or production and instead advise to use a proper signed certificate with a proper domain that is trusted within your organization. Trusting any certificate opens you up to person in the middle attacks easily so be careful.
Good luck 
Yeah im using it with self signed cert right now, in future its any problem to get proper cert.
But when i was setting up elastic it was 7.4.0 and everything was working fine till 7,5 or later dont remember its not yet on production im just testing it. Something have been changed?
This error is described in elastic blog as normal Configuring SSL, TLS, and HTTPS to secure Elasticsearch, Kibana, Beats, and Logstash | Elastic Blog
Publicly trusted authorities have very strict standards and auditing practices to ensure that a certificate is not created without validating proper identity ownership. For the purpose of this blog post, we will create a self-signed certificate for Kibana (meaning the generated certificate was signed by using its own private key). Due to clients not trusting self-signed Kibana certificates, you will see a message similar to the following in your Kibana logs, until proper trust is established by using certificates generated by an enterprise or public CA (here's the link to the issue in the Kibana repo). This issue does not affect your ability to work in Kibana:
[18:22:31.675] [error][client][connection] Error: 4443837888:error:14094416:SSL routines:ssl3_read_bytes:sslv3 alert certificate unknown:../deps/openssl/openssl/ssl/s3_pkt.c:1498:SSL alert number 46
But everything was working before with this setup im 101% on version 7.4 and laters
curl -v --cacert ca.crt https://kibana.ucti:5601
* Rebuilt URL to: https://kibana.ucti:5601/
*   Trying 172.21.1.253...
* TCP_NODELAY set
* Connected to kibana.ucti (172.21.1.253) port 5601 (#0)
* ALPN, offering h2
* ALPN, offering http/1.1
* successfully set certificate verify locations:
*   CAfile: ca.crt
  CApath: /etc/ssl/certs
* TLSv1.3 (OUT), TLS handshake, Client hello (1):
* TLSv1.3 (IN), TLS handshake, Server hello (2):
* TLSv1.2 (IN), TLS handshake, Certificate (11):
* TLSv1.2 (IN), TLS handshake, Server key exchange (12):
* TLSv1.2 (IN), TLS handshake, Server finished (14):
* TLSv1.2 (OUT), TLS handshake, Client key exchange (16):
* TLSv1.2 (OUT), TLS change cipher, Client hello (1):
* TLSv1.2 (OUT), TLS handshake, Finished (20):
* TLSv1.2 (IN), TLS handshake, Finished (20):
* SSL connection using TLSv1.2 / ECDHE-RSA-AES128-GCM-SHA256
* ALPN, server accepted to use http/1.1
* Server certificate:
*  subject: CN=my-kibana
*  start date: Oct 16 16:33:51 2019 GMT
*  expire date: Oct 15 16:33:51 2022 GMT
*  subjectAltName: host "kibana.ucti" matched cert's "kibana.ucti"
*  issuer: CN=Elastic Certificate Tool Autogenerated CA
*  SSL certificate verify ok.
> GET / HTTP/1.1
> Host: kibana.ucti:5601
> User-Agent: curl/7.58.0
> Accept: */*
>
< HTTP/1.1 302 Found
< location: /login?next=%2F
< kbn-name: my-kibana
< kbn-license-sig: 6bdb611766a1b516552ab26e3cccf68f7814667380231853c4bcd3dbb7204ef0
< kbn-xpack-sig: 671aef61ba68023108550220fea51bc9
< cache-control: no-cache
< content-length: 0
< Date: Tue, 21 Apr 2020 15:58:29 GMT
< Connection: keep-alive
<
* Connection #0 to host kibana.ucti left intact
The errors I saw looked like they were coming from Kibana but it could also be Kibana just reporting to you that the browser is encountering an issue?
Your browser could have updated and is being very picky about not trusting data from untrusted SSL/https connections? Difficult to say. I know that browsers are always changing their ways of how to deal with untrusted connections. For example, a lot of untrusted connections will not cache web resources and play other tricks.
It's almost better to create self signed certificates around a domain name and then set that domain name somewhere within your organization through hosts files or Active Directory or etc...
and then create a CA (Even if it is self signed) and install it on your computers or some other mechanism to get the browser to fully trust the domain name and for Kibana on the backend to trust it as well.
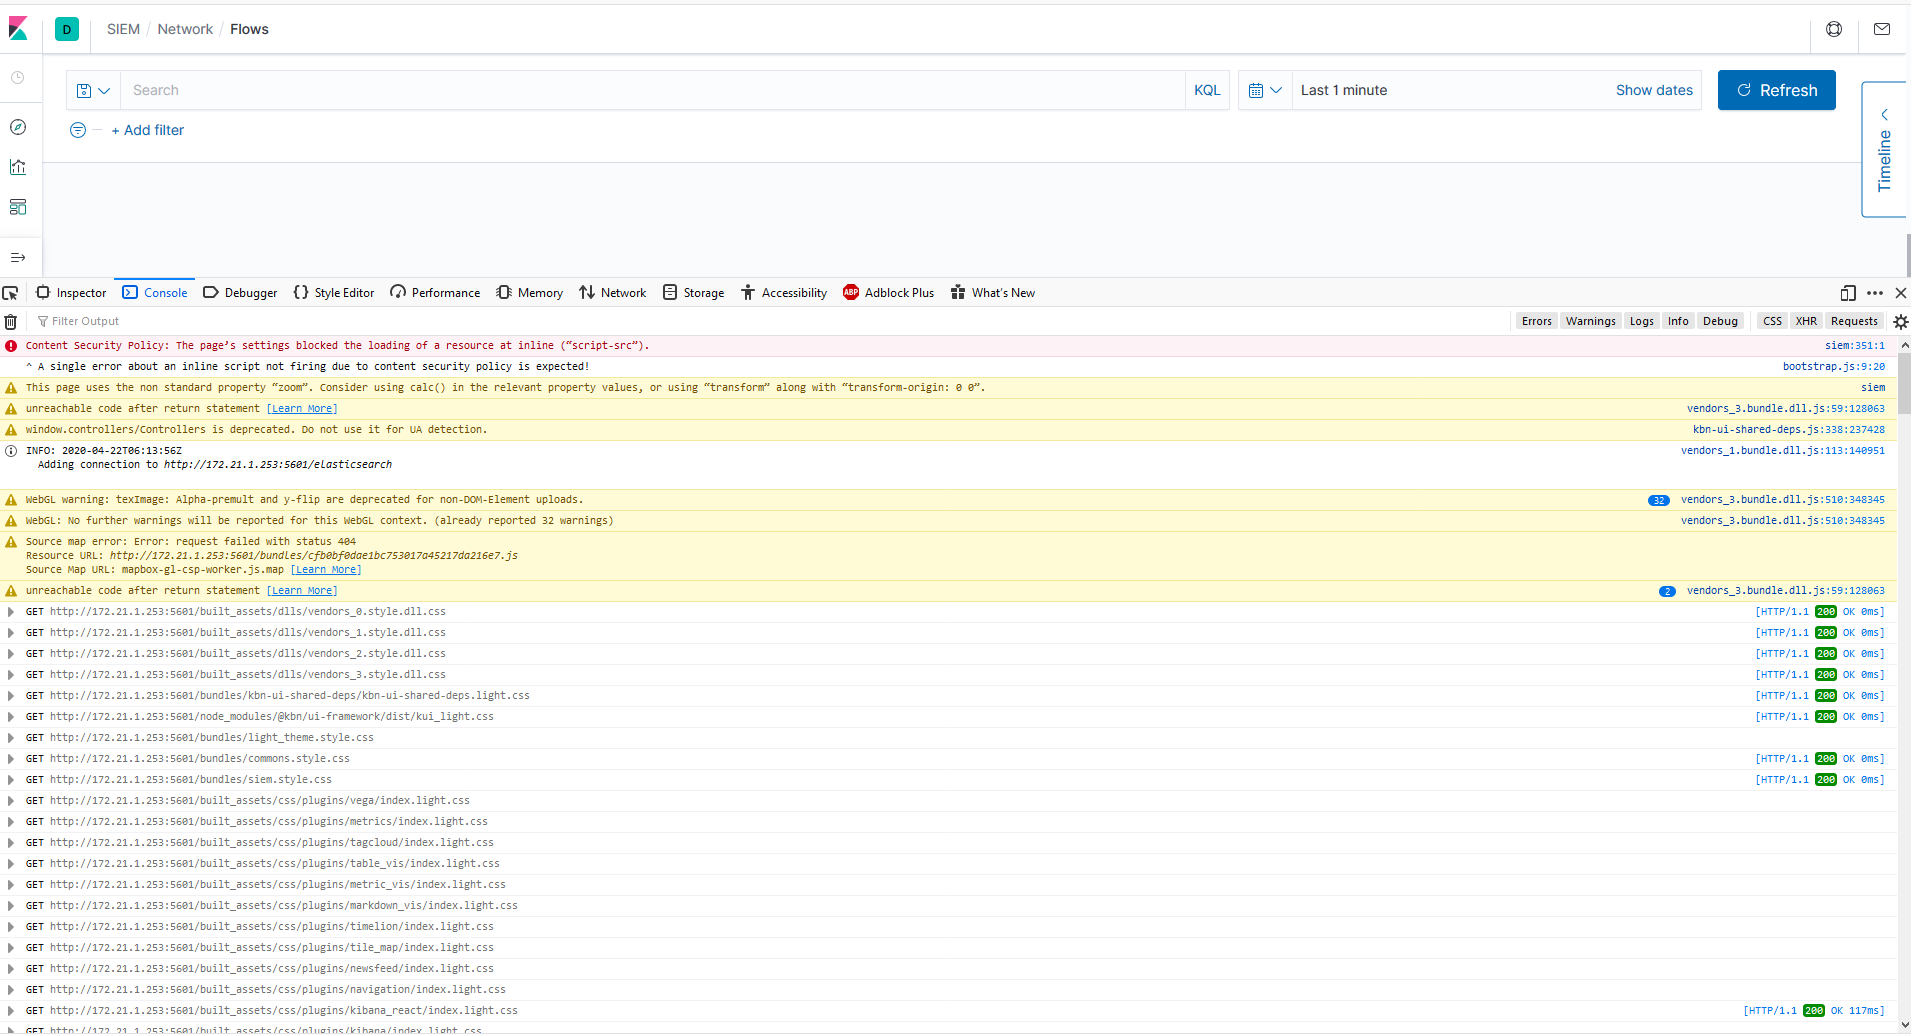
Otherwise to help trouble shoot where this is happening if good SSL connections are not an option or not easy to achieve, I would go to your Network tab and see if you're getting any RED entries within your browser. It is seeming like it is probably a connection from your browser to your Kibana backend that might be the issue and it is related to SSL self trusted certificates at this point.
I guess there will be more issues when something would be wrong with certificate.
On network tab there is only 200 status any 404 500.
But every tab every dashboard, and every element in SIEM works just fine. Only this one with network details. Is there any cache / file / index / saved object or something which can make issue? On elastic / kibana logs i dont see either any helpful error.
I could reinstall and do proper cert etc. but trying to solve problem.
Just turned off SSL at all and same result
The two queries you want to look at are graphql queries. In your network panel of Chrome you can filter by graphql and then look for ones that have flowTarget set to source or destination like these screen shots below. You want to see if they are returning 200 ok or if they are not returning. Also you want to see what the preview looks like as I show below.
That might yield insight into what is going on. I am wondering if you have a bug with a corner case or if the service is not returning anything or maybe it is just hanging?
© 2020. All Rights Reserved - Elasticsearch
Apache, Apache Lucene, Apache Hadoop, Hadoop, HDFS and the yellow elephant logo are trademarks of the Apache Software Foundation in the United States and/or other countries.