Hi community I have a question, I recently started using Elastic Stack for report my logs that basically are exceptions with stack trace information, like
2017-09-05 11:58:53 JFIORENZANO iisexpress Error System.Exception: It was not possible to update the waitress hostname
at Services.Bistro.Implementation.BistroService.UpdateApplicationHostName(Guid applicationId, String hostname) in D:\dev\bistro.services.bistroservice\Implementation\BistroService.Waitress.cs:line 279
at Services.Bistro.Implementation.BistroService.UpdateWaitress(BrWaitressViewModel waitress) in D:\dev\bistro.services.bistroservice\Implementation\BistroService.Waitress.cs:line 209
at Services.Bistro.Controllers.Api.BistroController.UpdateWaitress(BrWaitressViewModel waitress) in D:\dev\bistro.services.bistroservice\Controllers\Api\BistroController.cs:line 1048
basically the structure is timestamp, machinename process name and the error message with stack trace info
I have no clear how to use the visualizer of Kibana, right now I am just playing with it, but I want to use it in the right way and extract the most info that I can from my logs, due to that what I would like to know is what kind of visualizer do you frequently use with this kind of information?
@jcfiorenzano generally you'll want to process the messages into the various fields that you care about while ingesting them into Elasticsearch. How are you shipping the logs into Elasticsearch currently? Are you using Beats or Logstash or some other method?
I am using Logstash to feed elastic search, and in Logstash I use grok to parse the logs and those logs are sent to Logstash using Filebeats (I am just follow the getting started guide and made some modifications in the grok filter that's all)
@jcfiorenzano gotcha, you were looking for practical ways to use visualize with your log data. Are you only logging exceptions/stack-traces or are you logging other information as well?
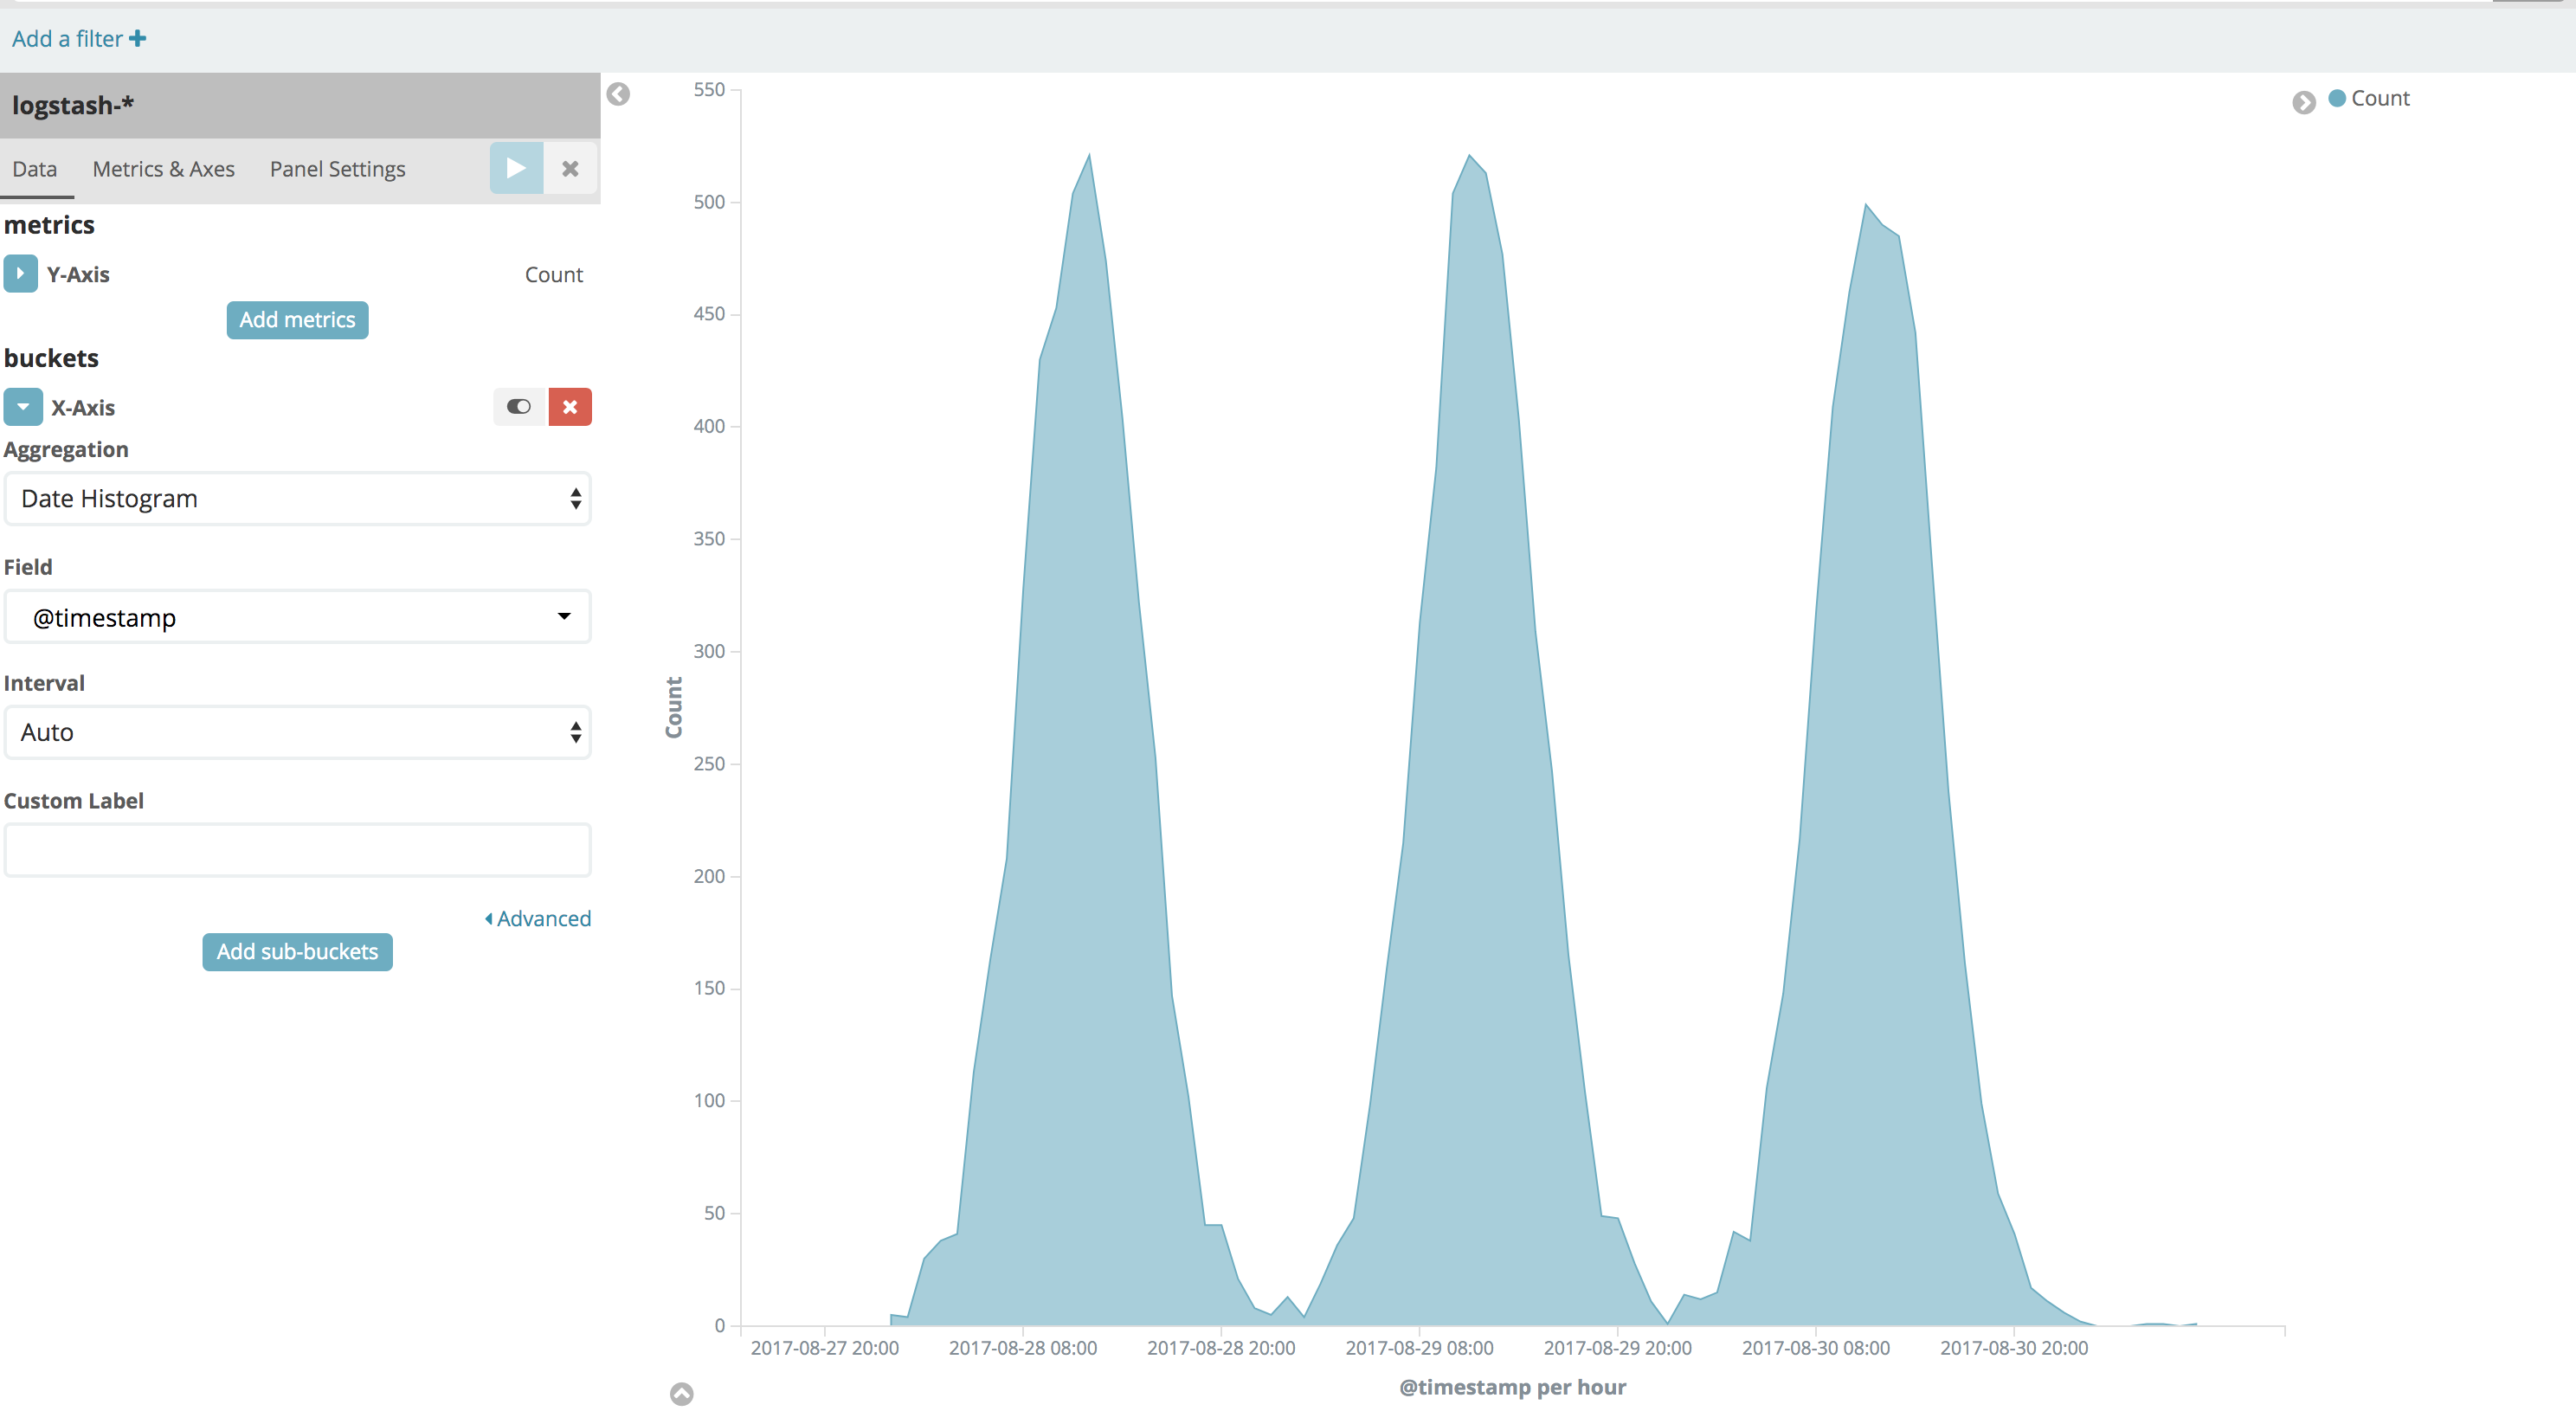
One useful thing you can do with just your exceptions is create a date histogram that will show you your overall rate of exceptions over time, that way you can see if they're increasing/decreasing (hopefully decreasing, but we know how that goes!):
You could also "split" that graph into each exception, essentially doing a "group by" in SQL terms, so you can see your rate for individual exceptions using something similar to the following:
That is exactly what I am looking for, practical uses, I like the idea about the histogram, besides exception\stack-trace I am logging the name of the host where the exception was thrown and the name of the process which crash and of course the timestamp