Anything interesting in the Kibana logs?

Please don't just post pictures and assume everyone can 1) see them and 2) know's what you want. It's rather rude.
Hi, @warkolm,
Thanks for your comments, I wasn't being rude, @magnusbaeck was asking for logs and I just posted.
Here I put it,
     I am working with elasticsearch and kibana, I wanted to provide ROLE based
 access  to Kibana users, so that only required dashboards would be accessed.
     I've followed  [steps given in](https://www.elastic.co/guide/en/shield/current/kibana.html)
I've also created users and assigned roles to them. When I am opening Kibana
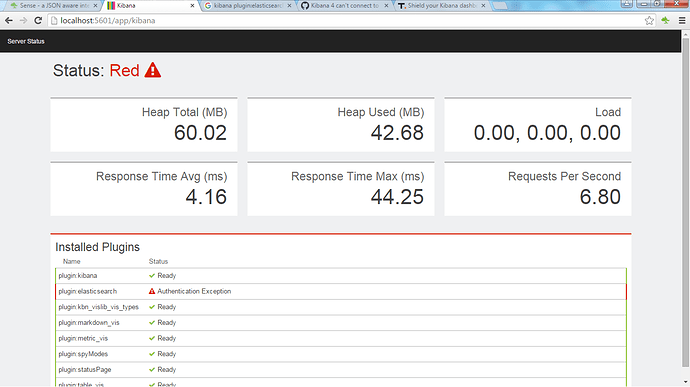
 in browser, initially it was giving STATUS: RED as shown in above image.
         After restarting kibana now I am able to start kibana, It also asks me to enter
user credentials but when I submit credentials, it just shows a blank page with a
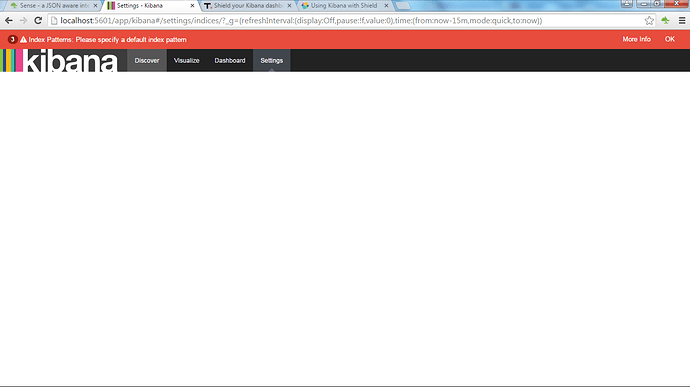
 message  "Index Patterns: Please specify a default index pattern" as show below,
When I click on More Info it shows,
Error: Please specify a default index pattern
    at http://localhost:5601/bundles/kibana.bundle.js:97016:16
    at processQueue (http://localhost:5601/bundles/commons.bundle.js:42339:29)
    at http://localhost:5601/bundles/commons.bundle.js:42355:28
    at Scope.$eval (http://localhost:5601/bundles/commons.bundle.js:43583:29)
    at Scope.$digest (http://localhost:5601/bundles/commons.bundle.js:43394:32)
    at Scope.$apply (http://localhost:5601/bundles/commons.bundle.js:43691:25)
    at HTMLDocument.<anonymous> (http://localhost:5601/bundles/commons.bundle.js:39820:25)
    at HTMLDocument.jQuery.event.dispatch (http://localhost:5601/bundles/commons.bundle.js:22721:10)
at HTMLDocument.elemData.handle (http://localhost:5601/bundles/commons.bundle.js:22407:29)Did you create an index pattern, as per here.
It doesn't allow me to do that, when I start kibana, It just comes up with
the above message "Please specify a default index pattern"So you can't get to settings to create a pattern?
Yes, I'm not able to create index pattern.
I understand that, but you cannot even get to the Settings section in Kibana?
Yes, I can't go to settings.
What happens if you try to go their directly - http://localhost:5601/app/kibana#/settings?
If go to any of the tab Discover, Visualize, Dashboard or Settings, it comes with the same message.
Please specify a default index pattern
Hi @warkolm ,
what does it mean by providing credentials in kibana.yml file
elasticsearch.username: kibana4-server
elasticsearch.password: password
because even though I specify here in kibana.yml file, still it asks on load
of "localhost:5601" and logs in with other uses too.
HI krushnat, i have got the same exception like what you have got and like what you have mentioned in the first two images ! did you find any solution for that? if you please reply for this
@sukesh: Can you open the console and see if there are any Javascript errors? In Chrome: View > Developer > Javascript Console
What version of Kibana are you running?
kibana 4.5.0 iam using , there is no javascript error
is this solved ?
Yes it was solved @Vishal_Sharma1
How do you resolved? It happen to me too, when I add shield plugin. I also changed kibana.yml but not working.

