Hello,
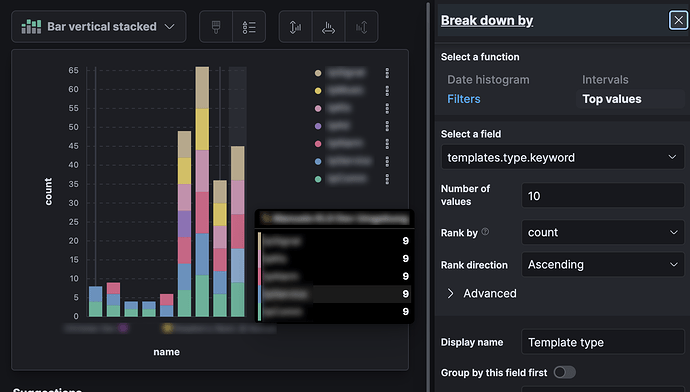
I would like to produce a rather simple bar chart that shows, for elements in a term aggregation, a unique count of one field in the aggregated objects that is then broken down according to a count of a different field within that same object structure.
As a first, the trivial case (unique count of ids, without breakdown) surely works, see screenshot below.
But when I add the breakdown, the amount of types appear correct but their count is not – the count of each is the same as the first id count of above, as seen below.
The relevant fields are structured like like this:
"templates": [
  {
    "name": "etyhet",
    "id": "5bc0npETZn"
  },
  {
    "name": "werwefrew",
    "id": "crqYR3X76e"
  },
  {
    "name": "fwer",
    "id": "fEqeUoodQa"
  }
]
And the mapping of those fields is as follows:
"templates": {
  "properties": {
    "id": {
      "type": "text",
      "fields": {
        "keyword": {
          "type": "keyword",
          "ignore_above": 256
        }
      }
    },
    "name": {
      "type": "text",
      "fields": {
        "keyword": {
          "type": "keyword",
          "ignore_above": 256
        }
      }
    }
  }
}
Could the problem be the mapping, that the array of objects is flattened into independent arrays of those objects' fields? I did try the 'nested' data type but that results in Lens not knowing anything about those objects' inner fields, and the intended visualization cannot be achieved that way.
Is it possible at all, and if so how?
Any leads would be very appreciated!
Best regards,
Christian

