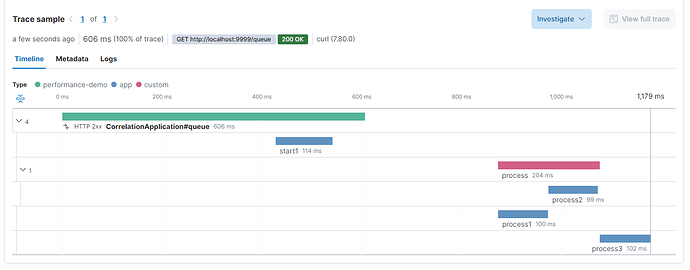
I have a use-case where tasks (Java Function<T, R> or Supplier) are potentially queued. If no task is currently running, the current thread directly executes the task. If another task is pending, the new task will be queued and the next task to arrive will execute itself and the queued task. These tasks are created from RabbitMQ messages, but that does not really matter and the same thing could be implemented with HTTP endpoints (see MWE at the end).
The problem now is that log correlation seems to be broken (?) or at least not supporting our use case. What we'd need is for logs to have the original transaction.id and trace.id of the queued task, not the ids of the processing thread. Spans are correctly recorded and linked to the original transaction in Kibana UI, but log correlation fields do not match.
Kibana version: 7.17.0
Elasticsearch version: 7.17.0
APM Server version: 7.17.0
APM Agent language and version: 1.29.0
Browser version: Chrome 98
Original install method (e.g. download page, yum, deb, from source, etc.) and version: Maven Central
Fresh install or upgraded from other version? Upgraded
Is there anything special in your setup? No special setup, log correlation does not match for a simple MWE.
Description of the problem including expected versus actual behavior. Please include screenshots (if relevant):
Steps to reproduce:
- Queue task which activates a different transaction / activates a child span from a different transaction
- Write logs with enable_log_correlation=true inside the task
- transaction.id and trace.id in logs do not match the trace.id of the active span
Errors in browser console (if relevant):
Provide logs and/or server output (if relevant):
MWE:
The problem can be reproduced with a simple Spring Boot application (latest Spring Boot)
@SpringBootApplication
@RestController
public class CorrelationApplication {
    private static final Logger LOG = LoggerFactory.getLogger(CorrelationApplication.class);

    private Transaction transaction;

    public static void main(final String[] args) {
        ElasticApmAttacher.attach();
        SpringApplication.run(CorrelationApplication.class, args);
    }

    @GetMapping("queue")
    public String queue() {
        LOG.info("START");
        transaction = ElasticApm.currentTransaction();
        log("start1", transaction, null);
        doWork("start1");

        return "started and cached tx " + f(transaction);
    }

    @GetMapping("process")
    public String process() throws Exception {
        LOG.info("PROCESS");
        if (transaction == null) {
            return "no qeueued transaction";
        }

        try (Scope activate = transaction.activate()) {
            LOG.info("TX current {}, processing {}", f(ElasticApm.currentTransaction()), f(transaction));
            final Span span = transaction.startSpan().setName("process");
            log("process1", transaction, span);
            doWork("process1");
            try (Scope unused = span.activate()) {
                LOG.info("SPAN current {}, processing {}", f(ElasticApm.currentSpan()), f(span));
                log("process2", transaction, span);
                doWork("process2");
            } finally {
                span.end();
            }
            log("process3", transaction, span);
            doWork("process3");
        }

        return "process cached tx " + f(transaction);
    }

    private void log(final String info, final Transaction tx, final Span span) {
        LOG.info("{} | current tx {} span {} | tx {} span {}", info, f(ElasticApm.currentTransaction()), f(ElasticApm.currentSpan()), f(tx), f(span));
    }

    private static String f(final Span span) {
        if (span == null) {
            return "(null)";
        }
        return span.getId() + '/' + span.getTraceId();
    }

    @CaptureSpan("inner span")
    private void doWork(final String name) {
        ElasticApm.currentSpan().setName(name);
        LockSupport.parkNanos(TimeUnit.MILLISECONDS.toNanos(100));
    }
}
Call with: curl localhost:8080/queue ; sleep 0.1 ; curl localhost:8080/process
Log output:
2022-03-07 14:08:09 [transaction.id=683f509c666ab749, trace.id=7ddca9e8ea4c65f85eb0cb0adddd6966] - START
2022-03-07 14:08:09 [transaction.id=683f509c666ab749, trace.id=7ddca9e8ea4c65f85eb0cb0adddd6966] - start1 | current tx 683f509c666ab749/7ddca9e8ea4c65f85eb0cb0adddd6966 span 683f509c666ab749/7ddca9e8ea4c65f85eb0cb0adddd6966 | tx 683f509c666ab749/7ddca9e8ea4c65f85eb0cb0adddd6966 span (null)
2022-03-07 14:08:10 [transaction.id=d214ef9b88093236, trace.id=fb6ad8d173d2b49d29db61aa38faa54a] - PROCESS
2022-03-07 14:08:10 [transaction.id=d214ef9b88093236, trace.id=fb6ad8d173d2b49d29db61aa38faa54a] - TX current d214ef9b88093236/fb6ad8d173d2b49d29db61aa38faa54a, processing 683f509c666ab749/7ddca9e8ea4c65f85eb0cb0adddd6966
2022-03-07 14:08:10 [transaction.id=d214ef9b88093236, trace.id=fb6ad8d173d2b49d29db61aa38faa54a] - process1 | current tx d214ef9b88093236/fb6ad8d173d2b49d29db61aa38faa54a span 683f509c666ab749/7ddca9e8ea4c65f85eb0cb0adddd6966 | tx 683f509c666ab749/7ddca9e8ea4c65f85eb0cb0adddd6966 span edda2140408eb496/7ddca9e8ea4c65f85eb0cb0adddd6966
2022-03-07 14:08:10 [transaction.id=d214ef9b88093236, trace.id=fb6ad8d173d2b49d29db61aa38faa54a] - SPAN current edda2140408eb496/7ddca9e8ea4c65f85eb0cb0adddd6966, processing edda2140408eb496/7ddca9e8ea4c65f85eb0cb0adddd6966
2022-03-07 14:08:10 [transaction.id=d214ef9b88093236, trace.id=fb6ad8d173d2b49d29db61aa38faa54a] - process2 | current tx d214ef9b88093236/fb6ad8d173d2b49d29db61aa38faa54a span edda2140408eb496/7ddca9e8ea4c65f85eb0cb0adddd6966 | tx 683f509c666ab749/7ddca9e8ea4c65f85eb0cb0adddd6966 span edda2140408eb496/7ddca9e8ea4c65f85eb0cb0adddd6966
2022-03-07 14:08:10 [transaction.id=d214ef9b88093236, trace.id=fb6ad8d173d2b49d29db61aa38faa54a] - process3 | current tx d214ef9b88093236/fb6ad8d173d2b49d29db61aa38faa54a span 683f509c666ab749/7ddca9e8ea4c65f85eb0cb0adddd6966 | tx 683f509c666ab749/7ddca9e8ea4c65f85eb0cb0adddd6966 span edda2140408eb496/7ddca9e8ea4c65f85eb0cb0adddd6966
I'd expect "process1" or at least "proces2" to write the same log correlation values as the first call of the queue() method, but the values are still the transaction and trace id from the second HTTP call.
application.properties:
logging.pattern.console= %d{yyyy-MM-dd HH:mm:ss} [%mdc] - %msg%n
elasticapm.properties:
enable_log_correlation=true
Related discussions:
Maybe this is not supported?
After discussion in Public API ignore transaction option · Issue #845 · elastic/apm-agent-java · GitHub, I've had a look at BlockingQueueContextPropagationTest.java, which handles the resumption of a "detached transaction" in a queue processor, but it does not mention anything about log correlation.
Traces show correctly in APM UI, but being able to correlate logs from asynchronous tasks would be even more helpful for us.
Thank you for your help!

