I was able to set up the APM Java Agent and activated the log_correlation option without further issues.
Next, I got the tool to log into a file by using the ECS Java Logging tool and its standard settings for log4j (configure a file and log appender and add those to the rootLogger).
My Java tool is able to execute Groovy Scripts, which can be configured on runtime. As the Groovy framework has not been implemented yet, I added a monitored method to the APM Java Agent org.groovyrunner.AbstracScript#runScript, so now I am able to see the span from within APM.
Now I’d like to see any log entries generated within this span. For this, I instantiate a Logger within my Groovy code and log an info message. Right after, I see how the entry gets sent to Elasticsearch but the fields trace.id and transaction.id are nowhere to be found.
Is there anything else I can do on my side to get this running? I have no possibility to modify the source code of the Java app or Groovy library. I can only edit the Scripts and change the configuration of the Elastic Stack.
I’d appreciate any hints and I can also provide configuration files upon request.
Thanks,
Pablo
P.S. in case you wonder the Java app is Jira and the Groovy tool is called ScriptRunner for Jira.
We just merged a bug fix yesterday that prevented log correlation from working when log4j2 is used without slf4j. We currently have hard time deploying a daily snapshot, but if you are quick enough, you can download the latest master build artefact and try it out.
Try setting log_level to debug and see if logs provide any hint on that.
Even better, if you can, try to debug MdcActivationListener#before() and see if things work as expected.
Maybe you already know that, but worth explaining anyway: when you enable the log correlation, this means that when the span gets activated, the trace.id and transaction.id will be added to the MDC map. So the two things to be aware are:
There must be a transaction or span active in order for a logging event to be able to see the related APM trace IDs
If you do not update your logging configuration to include these MDC entries in the log messages, they won't show up. Normally, in log4j this is done through the %X placeholder in the pattern configuration.
If you carefully follow our log correlation guide and still can't figure it out, please let us know and we'll see how we proceed.
The APM Agent Property enable_log_correlation is set to true and I also set trace_methods=com.onresolve.scriptrunner.runner.AbstractScriptRunner#runScript, which I can find using APM Observability.
In addition to that, I added ecs-logging-core-1.0.1.jar and log4j-ecs-layout-1.0.1.jar to Tomcat's lib folder.
Also I included the appenders to the log4j.properties file:
#####################################################
# LOGGING LEVELS
#####################################################
# To turn more verbose logging on - change "WARN" to "DEBUG"
log4j.rootLogger=INFO, filelog, ecslog, ecsconsolelog
I can also activate the span directly within my script using the API methods, but no matter what I log from within the same code, it does not receive the previously mentioned ids.
Do you have any other suggestions? Can it be because it is Groovy code and not Java?
If there is a span and it is activated on the thread that runs the script, then any logging event done on that thread should be able to find these IDs in the MDC.
Two things to try out:
try the new (and experimental) log_ecs_reformatting config. It should automatically reformat your existing logs to ECS-JSON format in a new log file (you can keep or replace the original log). You should remove any ECS-logging dependency and configuration if you try it out, the agent will apply it automatically.
Download the latest agent built from master, and set log_level=debug, a valid log_file and log_format_file=JSON. See details about all of those in the logging config docs. With these, the agent log will be ECS-formatted, and it will include the transaction/trace IDs, so it can provide us hints with what's going on.
I recently had time to test the new log_ecs_reformatting. After enabling it, every single log that was being generated got an reformatted ecs.json file. I also turned on the debugging option as suggested by you.
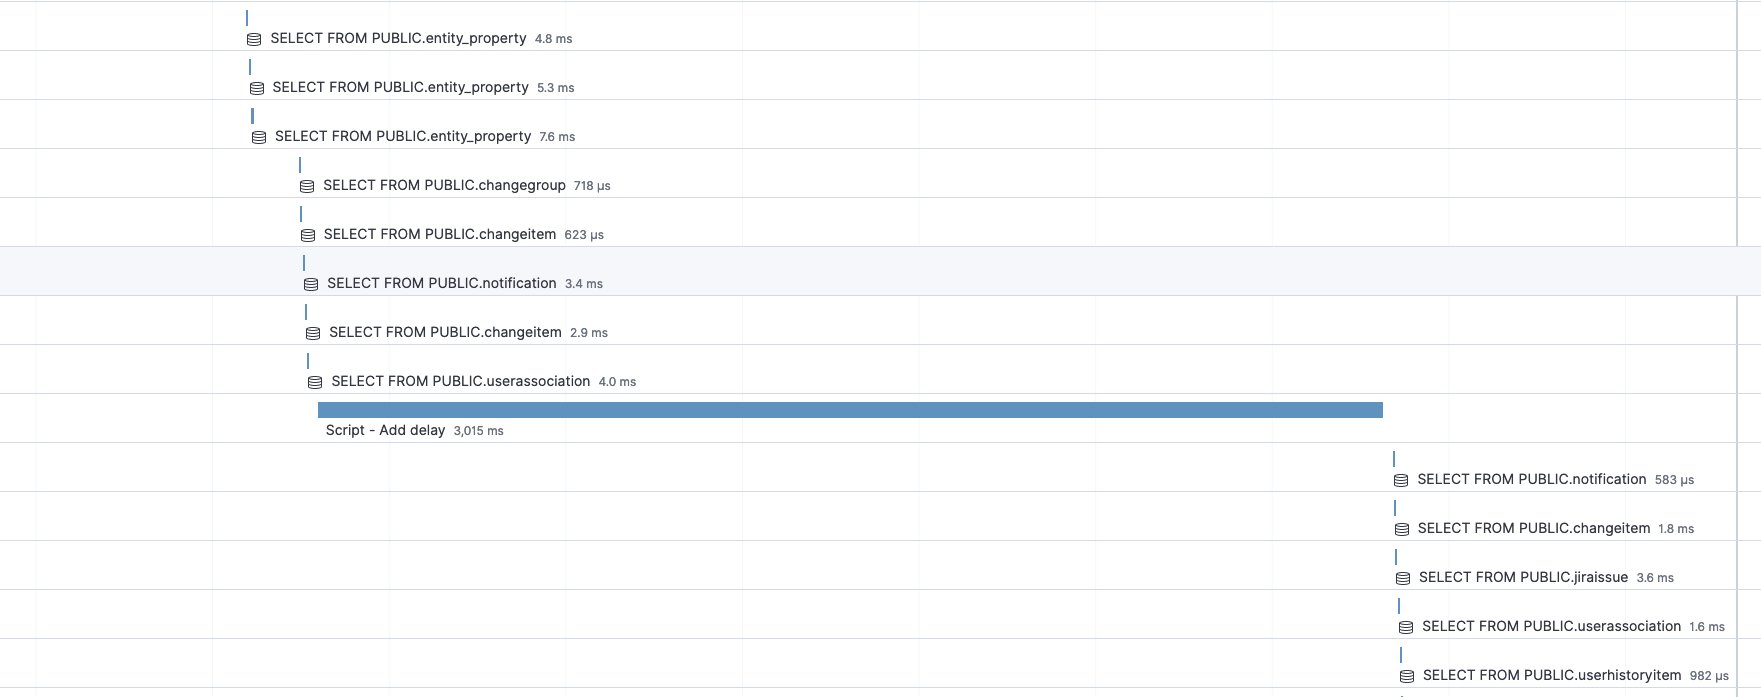
Sadly, we are still unable to correlate log entries generated from within our scripts to the transaction being executed. Here is the Groovy script which is executed at runtime:
@Grapes([
@Grab("co.elastic.apm:apm-agent-api:1.23.0")
])
import co.elastic.apm.api.ElasticApm
import co.elastic.apm.api.Span
import org.apache.log4j.Level
import org.apache.log4j.Logger
// this variable is binded through script properties
log.setLevel(Level.DEBUG)
// adding span
Span transaction = ElasticApm.currentSpan().setName("Script - Add delay")
// logging transaction id
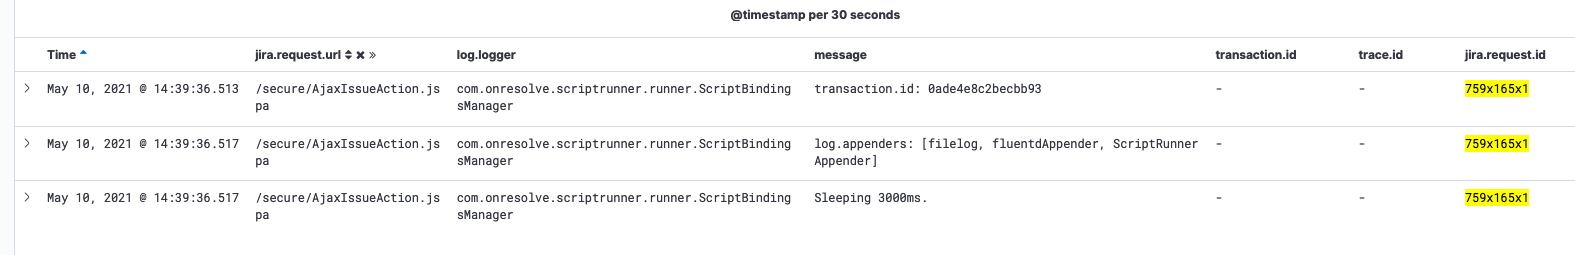
log.info("transaction.id: " + transaction.id)
// logging appender info
log.info("log.appenders: ${log.getParent().getAllAppenders().collect{ it.name }}")
// this should have a transaction.id appended
log.info("Sleeping 3000ms.")
sleep(3000)
Sorry, I was quite busy lately with other stuff. So, when you tried the log_ecs_reformatting option, didn't the related log messages in the ecs.json file contain the trace and transaction IDs? Can you provide the related log lines that are produced when using it? Can you share the agent debug log?
If the ecs.json file entries did not contain these IDs, then the best thing I can propose at this point is to setup a dev env with our agent code and set a breakpoint at MdcActivationListener#before(). Try to see why the IDs are not added to the MDC as expected.
Apache, Apache Lucene, Apache Hadoop, Hadoop, HDFS and the yellow elephant
logo are trademarks of the
Apache Software Foundation
in the United States and/or other countries.