Logs Not displaying in kibana while using newly created index but displaying when using default logstash-*

Hi,

i am configured server with fluentd, elasticsearch and kibana to ship logs to server from client node and display in kibana.
When i am configuring kibana index using default logstash-* index logs are displaying in kibana, but when i am using the index which i created is not displaying logs in kibana.
Please help to troubleshoot the issue.
elasticsearch and kibana version -- 5.x.x

screenshot of non working kibana display:

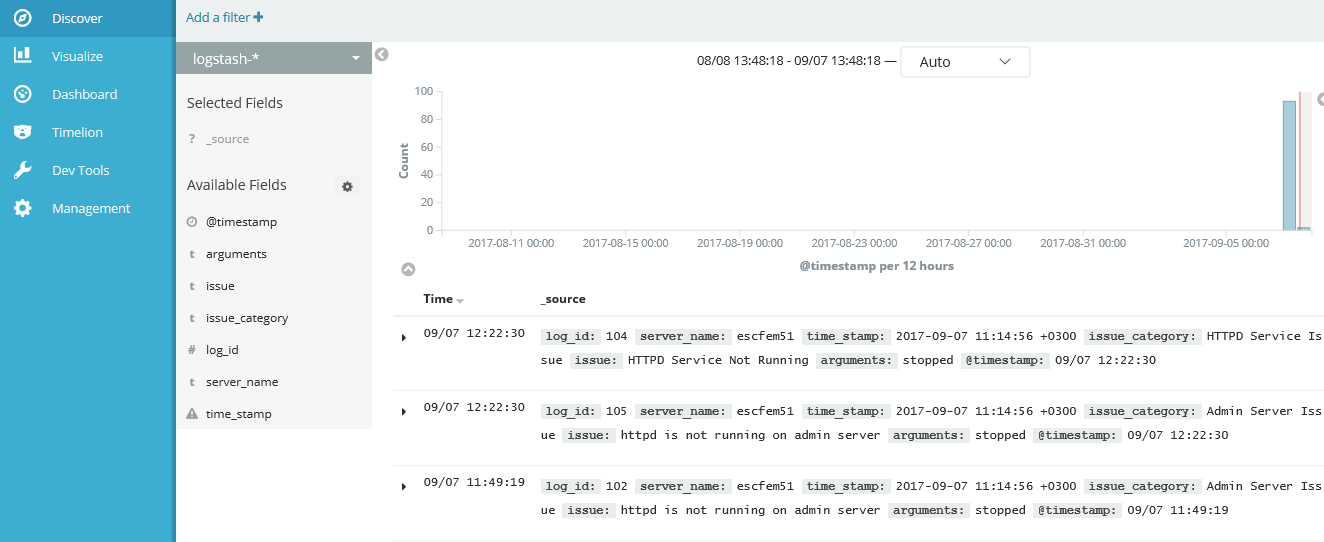
screenshot of working kibana display:

curl -XGET http://localhost:9200/_cat/indices?v
health status index uuid pri rep docs.count docs.deleted store.size pri.store.size
yellow open logstash-2017.09.07 liFB3tS4QcKLqmTGtGs8nQ 5 1 95 0 223.8kb 223.8kb
yellow open issuepredtool 3mcGPLT7RKSeHslHlPua5w 5 1 0 0 955b 955b
yellow open fluentd juxdqw3QRNmH0NyMp9ZNTw 5 1 105 0 81.3kb 81.3kb
yellow open .kibana Z_EGBqWFSn6wtdhc0mYDsg 1 1 5 0 23.8kb 23.8kb
yellow open logstash-2017-09-07 IuC0Cn66RFiESfRgCCxCaQ 5 1 0 0 955b 955b
yellow open test 4DzRjVhhT8KoGTuOrkpSYA 5 1 1 4 4.6kb 4.6kb


Working index - auto generated
curl -XGET http://localhost:9200/logstash-2017.09.07
{"logstash-2017.09.07":{"aliases":{},"mappings":{"fluentd":{"properties":{"@timestamp":{"type":"date"},"arguments":{"type":"text","fields":{"keyword":{"type":"keyword","ignore_above":256}}},"issue":{"type":"text","fields":{"keyword":{"type":"keyword","ignore_above":256}}},"issue_category":{"type":"text","fields":{"keyword":{"type":"keyword","ignore_above":256}}},"log_id":{"type":"long"},"server_name":{"type":"text","fields":{"keyword":{"type":"keyword","ignore_above":256}}},"time_stamp":{"type":"text","fields":{"keyword":{"type":"keyword","ignore_above":256}}}}}},"settings":{"index":{"creation_date":"1504778910233","number_of_shards":"5","number_of_replicas":"1","uuid":"liFB3tS4QcKLqmTGtGs8nQ","version":{"created":"5050299"},"provided_name":"logstash-2017.09.07"}}}}

Not working- index created by me.
curl -XGET http://localhost:9200/issuepredtool
{"issuepredtool":{"aliases":{},"mappings":{"fluentd":{"properties":{"@timestamp":{"type":"date"},"arguments":{"type":"text","fields":{"keyword":{"type":"keyword","ignore_above":256}}},"issue":{"type":"text","fields":{"keyword":{"type":"keyword","ignore_above":256}}},"issue_category":{"type":"text","fields":{"keyword":{"type":"keyword","ignore_above":256}}},"log_id":{"type":"long"},"server_name":{"type":"text","fields":{"keyword":{"type":"keyword","ignore_above":256}}},"time_stamp":{"type":"date","fields":{"keyword":{"type":"keyword","ignore_above":256}}}}}},"settings":{"index":{"creation_date":"1504781949934","number_of_shards":"5","number_of_replicas":"1","uuid":"3mcGPLT7RKSeHslHlPua5w","version":{"created":"5050299"},"provided_name":"issuepredtool"}}}}

It looks like the issuepredtool index does not have any data in it.

I think issuepredtool have data.. please see below output.

curl -i -XHEAD http://localhost:9200/issuepredtool
HTTP/1.1 200 OK
content-type: application/json; charset=UTF-8
content-length: 764

curl -i -XHEAD http://localhost:9200/logstash-2017.09.07
HTTP/1.1 200 OK
content-type: application/json; charset=UTF-8
content-length: 776

According to the output from your cat indices call it does not. The index exists, but is empty. Why would running a HEAD request indicate whether the index has data or not?

i am not sure how to check data.. got some command while searching , that is why ... thanks ..

could you please help why the logs are not loading in to new index (issuepredtool)... but the logs are loading in to default index (logstash-*).

There is probably something wrong in your ingest pipeline. Have you checked the logs?

couldn't see any error logs from fluentd or elasticsearch

i searched the error logs in elasticsearch , fluentd and message logs. i could see only the below error in message log file.

kibana: {"type":"log","@timestamp":"2017-09-07T10:09:58Z","tags":["error","elasticsearch","admin"],"pid":14699,"message":"Request error, retrying\nHEAD http://localhost:9200/ => connect ECONNREFUSED 127.0.0.1:9200"}
kibana: {"type":"log","@timestamp":"2017-09-07T10:09:58Z","tags":["status","plugin:elasticsearch@5.5.2","error"],"pid":14699,"state":"red","message":"Status changed from green to red - Unable to connect to Elasticsearch at http://localhost:9200.","prevState":"green","prevMsg":"Kibana index ready"}
Sep 7 10:09:58
kibana: {"type":"log","@timestamp":"2017-09-07T10:09:58Z","tags":["status","ui settings","error"],"pid":14699,"state":"red","message":"Status changed from green to red - Elasticsearch plugin is red","prevState":"green","prevMsg":"Ready"}
kibana: {"type":"log","@timestamp":"2017-09-07T10:10:08Z","tags":["warning","config"],"pid":31736,"message":"Settings for "network" were not applied, check for spelling errors and ensure the plugin is loaded."}
{"type":"log","@timestamp":"2017-09-07T10:10:09Z","tags":["error","elasticsearch","admin"],"pid":31736,"message":"Request error, retrying\nHEAD http://localhost:9200/ => connect ECONNREFUSED 127.0.0.1:9200"}
kibana: {"type":"log","@timestamp":"2017-09-07T10:10:09Z","tags":["status","plugin:elasticsearch@5.5.2","error"],"pid":31736,"state":"red","message":"Status changed from yellow to red - Unable to connect to Elasticsearch at http://localhost:9200.","prevState":"yellow","prevMsg":"Waiting for Elasticsearch"}
kibana: {"type":"log","@timestamp":"2017-09-07T10:10:09Z","tags":["status","ui settings","error"],"pid":31736,"state":"red","message":"Status changed from uninitialized to red - Elasticsearch plugin is red","prevState":"uninitialized","prevMsg":"uninitialized"}
kibana: {"type":"log","@timestamp":"2017-09-07T13:14:09Z","tags":["error","elasticsearch","admin"],"pid":31736,"message":"Request error, retrying\nHEAD http://localhost:9200/ => connect ECONNREFUSED 127.0.0.1:9200"}
kibana: {"type":"log","@timestamp":"2017-09-07T13:14:09Z","tags":["status","plugin:elasticsearch@5.5.2","error"],"pid":31736,"state":"red","message":"Status changed from green to red - Unable to connect to Elasticsearch at http://localhost:9200.","prevState":"green","prevMsg":"Kibana index ready"}
elasticsearch: Caused by: com.fasterxml.jackson.dataformat.yaml.snakeyaml.error.MarkedYAMLException: while parsing a block mapping
elasticsearch: at com.fasterxml.jackson.dataformat.yaml.snakeyaml.error.MarkedYAMLException.from(MarkedYAMLException.java:27)

can we mention some where which index need to use for storing data..

Why the newly created index not loading data and only the auto created logstash-* only loading data.

can anyone please help on this.

This topic was automatically closed 28 days after the last reply. New replies are no longer allowed.